Powering through uncertainty

Uncertainty characterises the current outlook for the global economy and markets. Amid persistent noise and negotiations on US trade policy and tariffs, business and market confidence have taken a hit, with ramifications for growth and capital. Major central banks have commenced rate cuts, with the easing cycle poised to continue. The IMF expects global growth to drop to 2.8% in 2025 and 3.0% in 2026, down from 3.3% in 2024.
We have been here before – in past economic downturns, and financial market and covid-driven disruption. The key message is that there is inherent uncertainty in the timing and depth of any downturn. Instead of responding impulsively to short-term market risks, investors should take a step back and explore opportunities to strengthen overall portfolio diversification. This is a long-term approach, and so there is no “right time” to invest in companies with these characteristics: shoring up the resilience of investment cash flows, and providing sufficient portfolio diversification is an ongoing process that should ultimately lead to better risk-adjusted returns over time.
Infrastructure is one such resilient asset class, where the underlying businesses don’t rely on the economic sun shining. Quality infrastructure companies can offer reliable demand and predictable earnings. Moreover, at Magellan Investment Partners we believe this is best achieved through investing in companies providing essential services that demonstrate clear competitive advantages and that are exposed to structural demand growth. These are high-quality core infrastructure businesses, which by their nature are even more defensive than the broader infrastructure universe. Our insistence upon reliable cash flow generation leads us to exclude companies whose earnings have material exposure to competition, movements in commodity prices or sovereign risk. Even under stress, these companies typically show resilience.
Given that these high-quality infrastructure businesses typically have a shallower downturn in activity when the economy weakens, with demand and operations suffering minimal slowdown, they are in a position to recover quickly as the economic cycle turns. The shallower dip in business also means the share prices of such companies typically fall less. For investors, this supports long-term compounding of capital.
Infrastructure is resilient when it matters most
As a case in point, our analysis shows that infrastructure companies that meet our strict definition of infrastructure have shown they fall far less during periods of market duress, which can support real returns through time.
We find that, in a down market1, our listed infrastructure strategy typically falls by less than 50% of what is endured by global equities, and 25% less than the infrastructure benchmark2. The difference in performance is even more marked when the market downturn is driven by deterioration in the economic outlook. Our analysis shows that in a non-rate-led downturn, the MFG Core Infrastructure Strategy has historically fallen by 38% of that of the broader market, on average.
Figure 1: The MFG Core Infrastructure Strategy provides less downside capture during equity market drawdowns
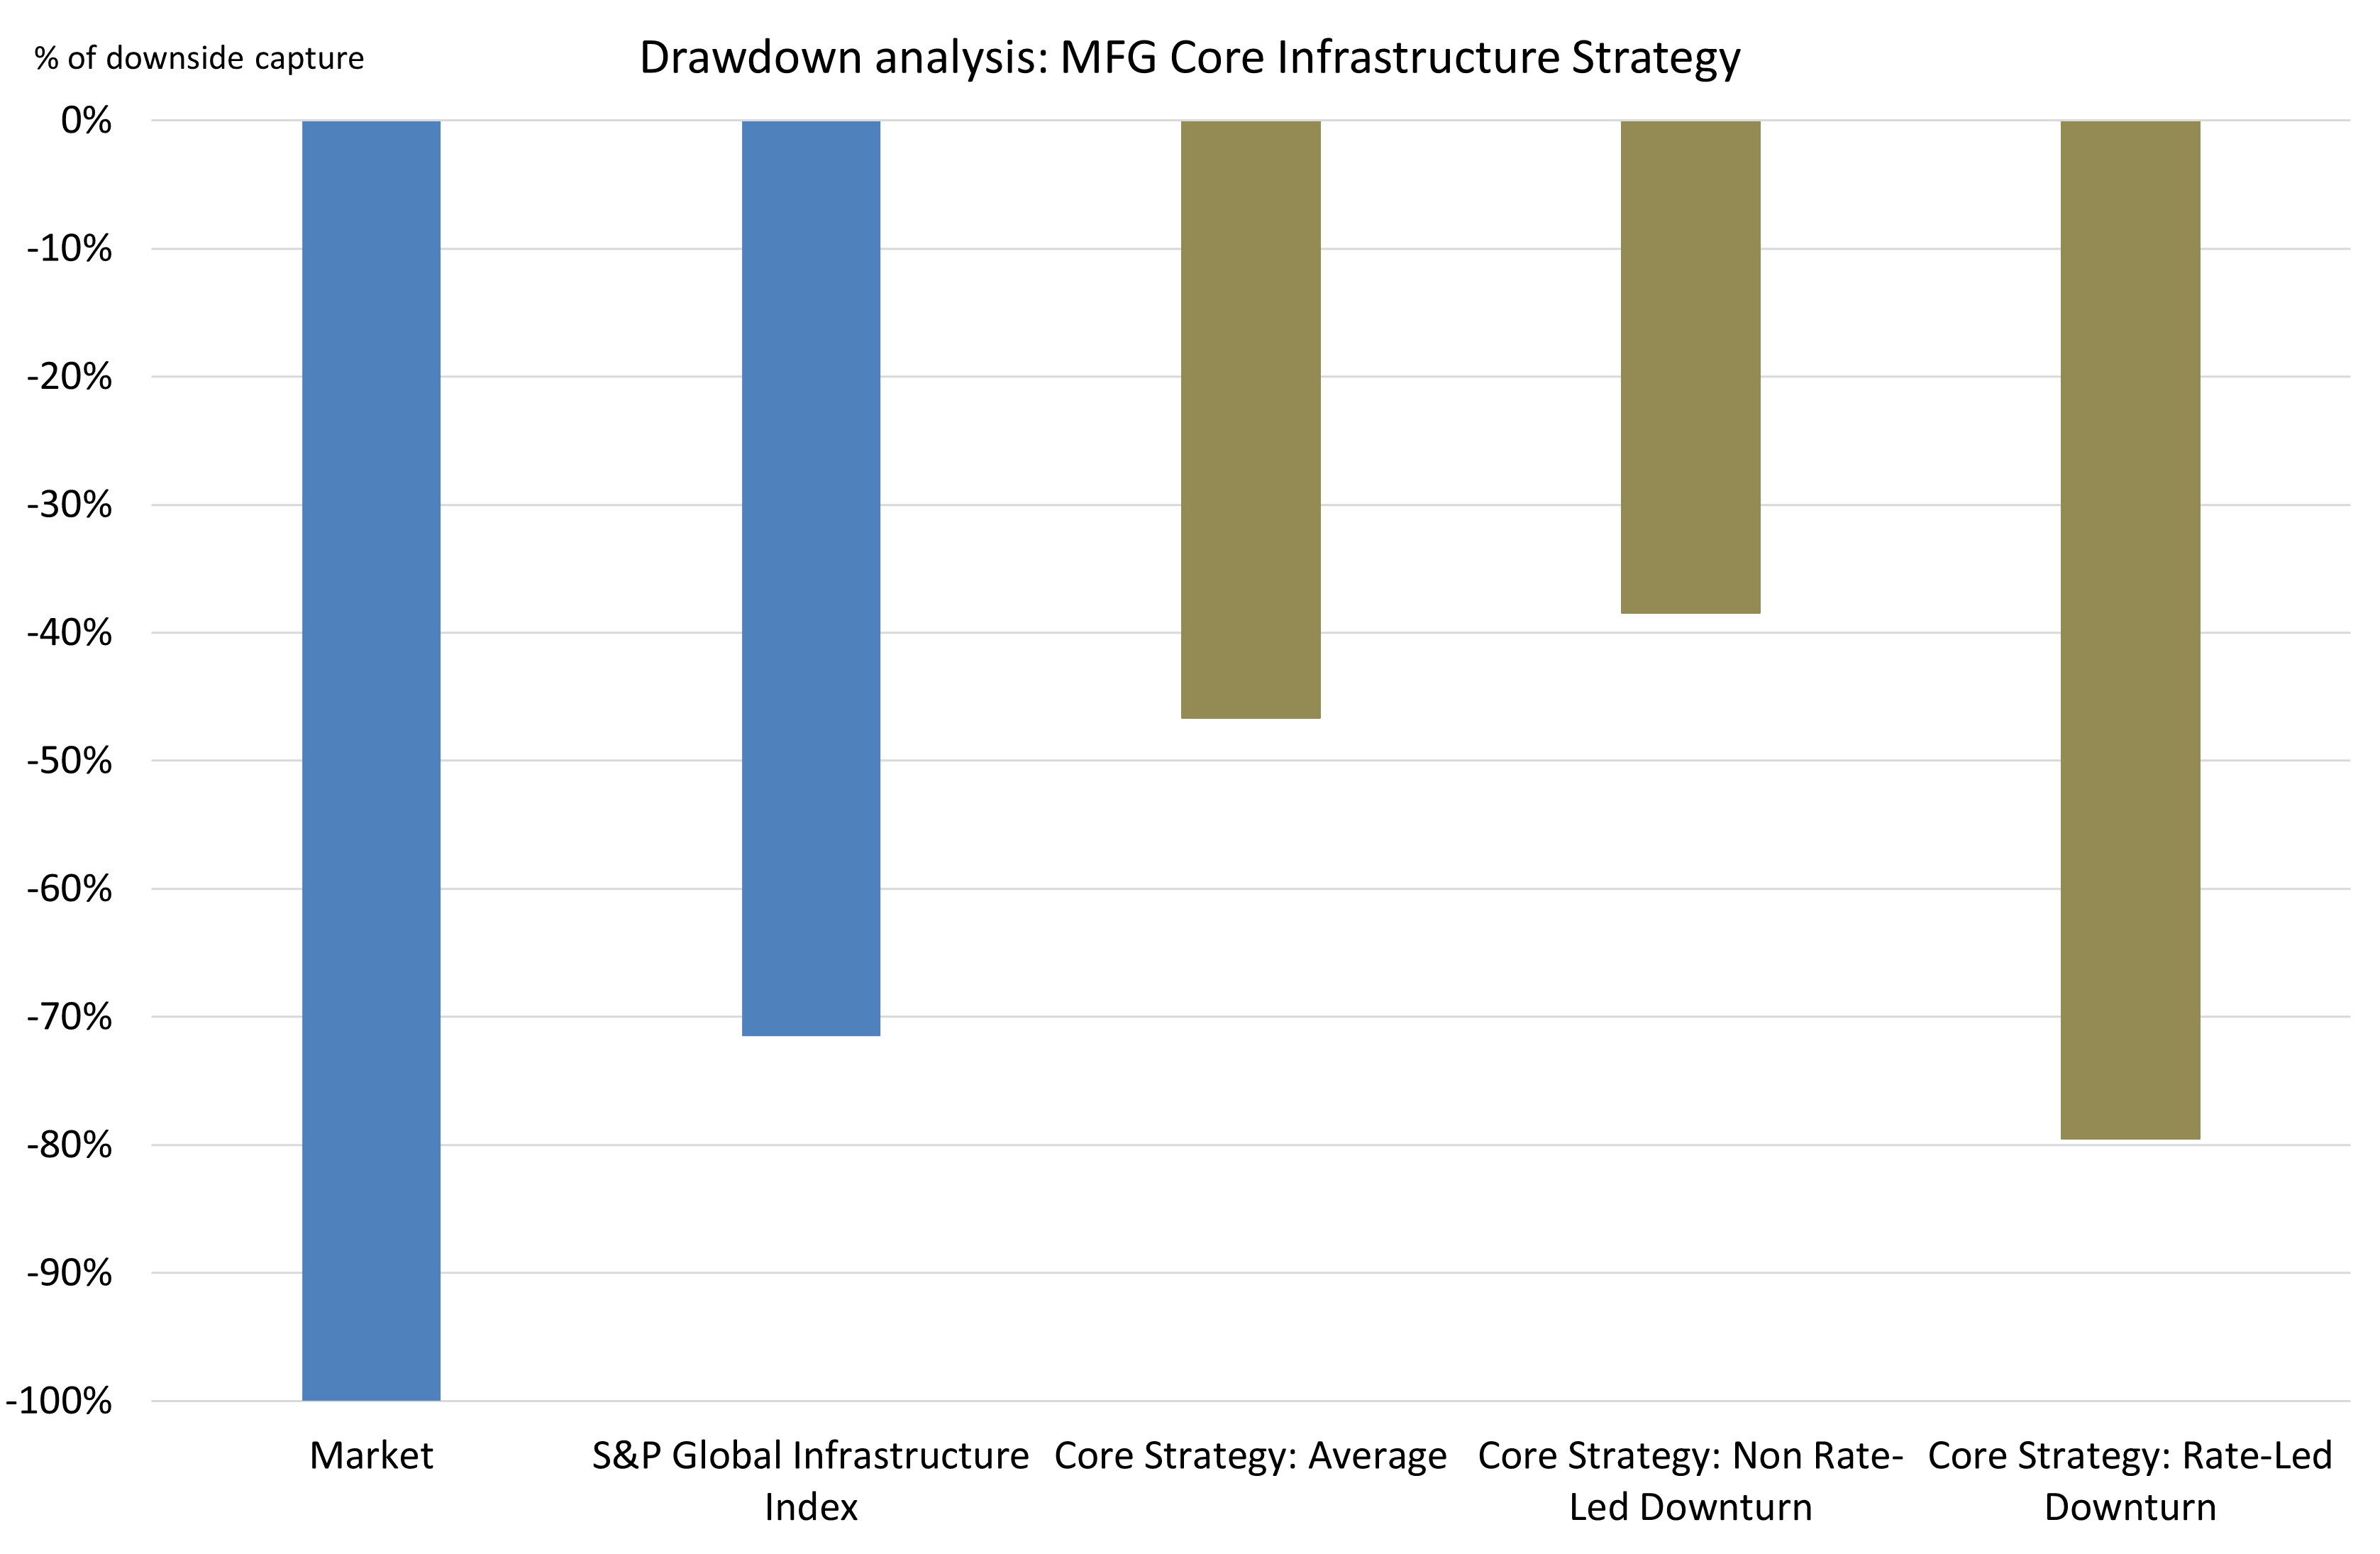
Source: Bloomberg, Magellan Investment Partners. Equity market drawdowns are defined as events where the MSCI World NTR Index (A$ Hedged) has declined by 5% or more. Our analysis indicates that the majority of downturns are led by economic activity, not rates. All figures are shown in AUD. Downside capture is presented net of the highest fee charged to any client using the MFG Core Infrastructure strategy. *Please see further disclaimer information at the end of this document.
We see this defensiveness as being a central plank in how infrastructure is able to deliver attractive risk-adjusted returns through the cycle. Moreover, we view this resilience not as luck, but as the natural outcome of owning assets whose cash flows are underwritten by regulation, long-term contracts and indispensable demand.
Resilience is driven by fundamentals: regulation provides for steady returns
Regulation: Limiting the downside
During the GFC, US electricity consumption was down 2%3 in 2008-2009 as stable residential demand limited the impact of a slump in industrial and commercial demand. This slump was short-lived, and total demand rebounded back above 2007 levels in 2010. This clearly highlights the resilient demand profile for these companies, but that is only half the picture for these high-quality businesses.
In the jurisdictions in which we invest, a favourable and stable regulatory environment is supportive for the returns and capital growth for regulated utilities. Some examples of these high-quality utilities include WEC Energy and Xcel Energy in the USA, Italy’s Terna and the UK’s National Grid. Ultimately, these companies are regulated at the point of earnings, which means they are entitled to recover their costs and earn a fair return on capital. Practically, this manifests in such a way that to the extent costs go up or demand falls, these companies are entitled to lift prices or use other regulatory mechanisms to recover lost earnings.
As a result, high-quality, regulated utilities can achieve solid financial results, even in challenging conditions. This is demonstrated in Figure 2 below, which shows return on equity (ROE) for a sample set of high-quality, US regulated utilities. The chart shows that even in the 2007-2009 recession, a major and broad-based global downturn, the achieved ROE for these high-quality regulated utilities fell from around 10.3% to around 9.5%; and this at a time when most companies were struggling to maintain profitability.
Figure 2: High-quality, regulated utilities can sustain solid earnings in tough economic times
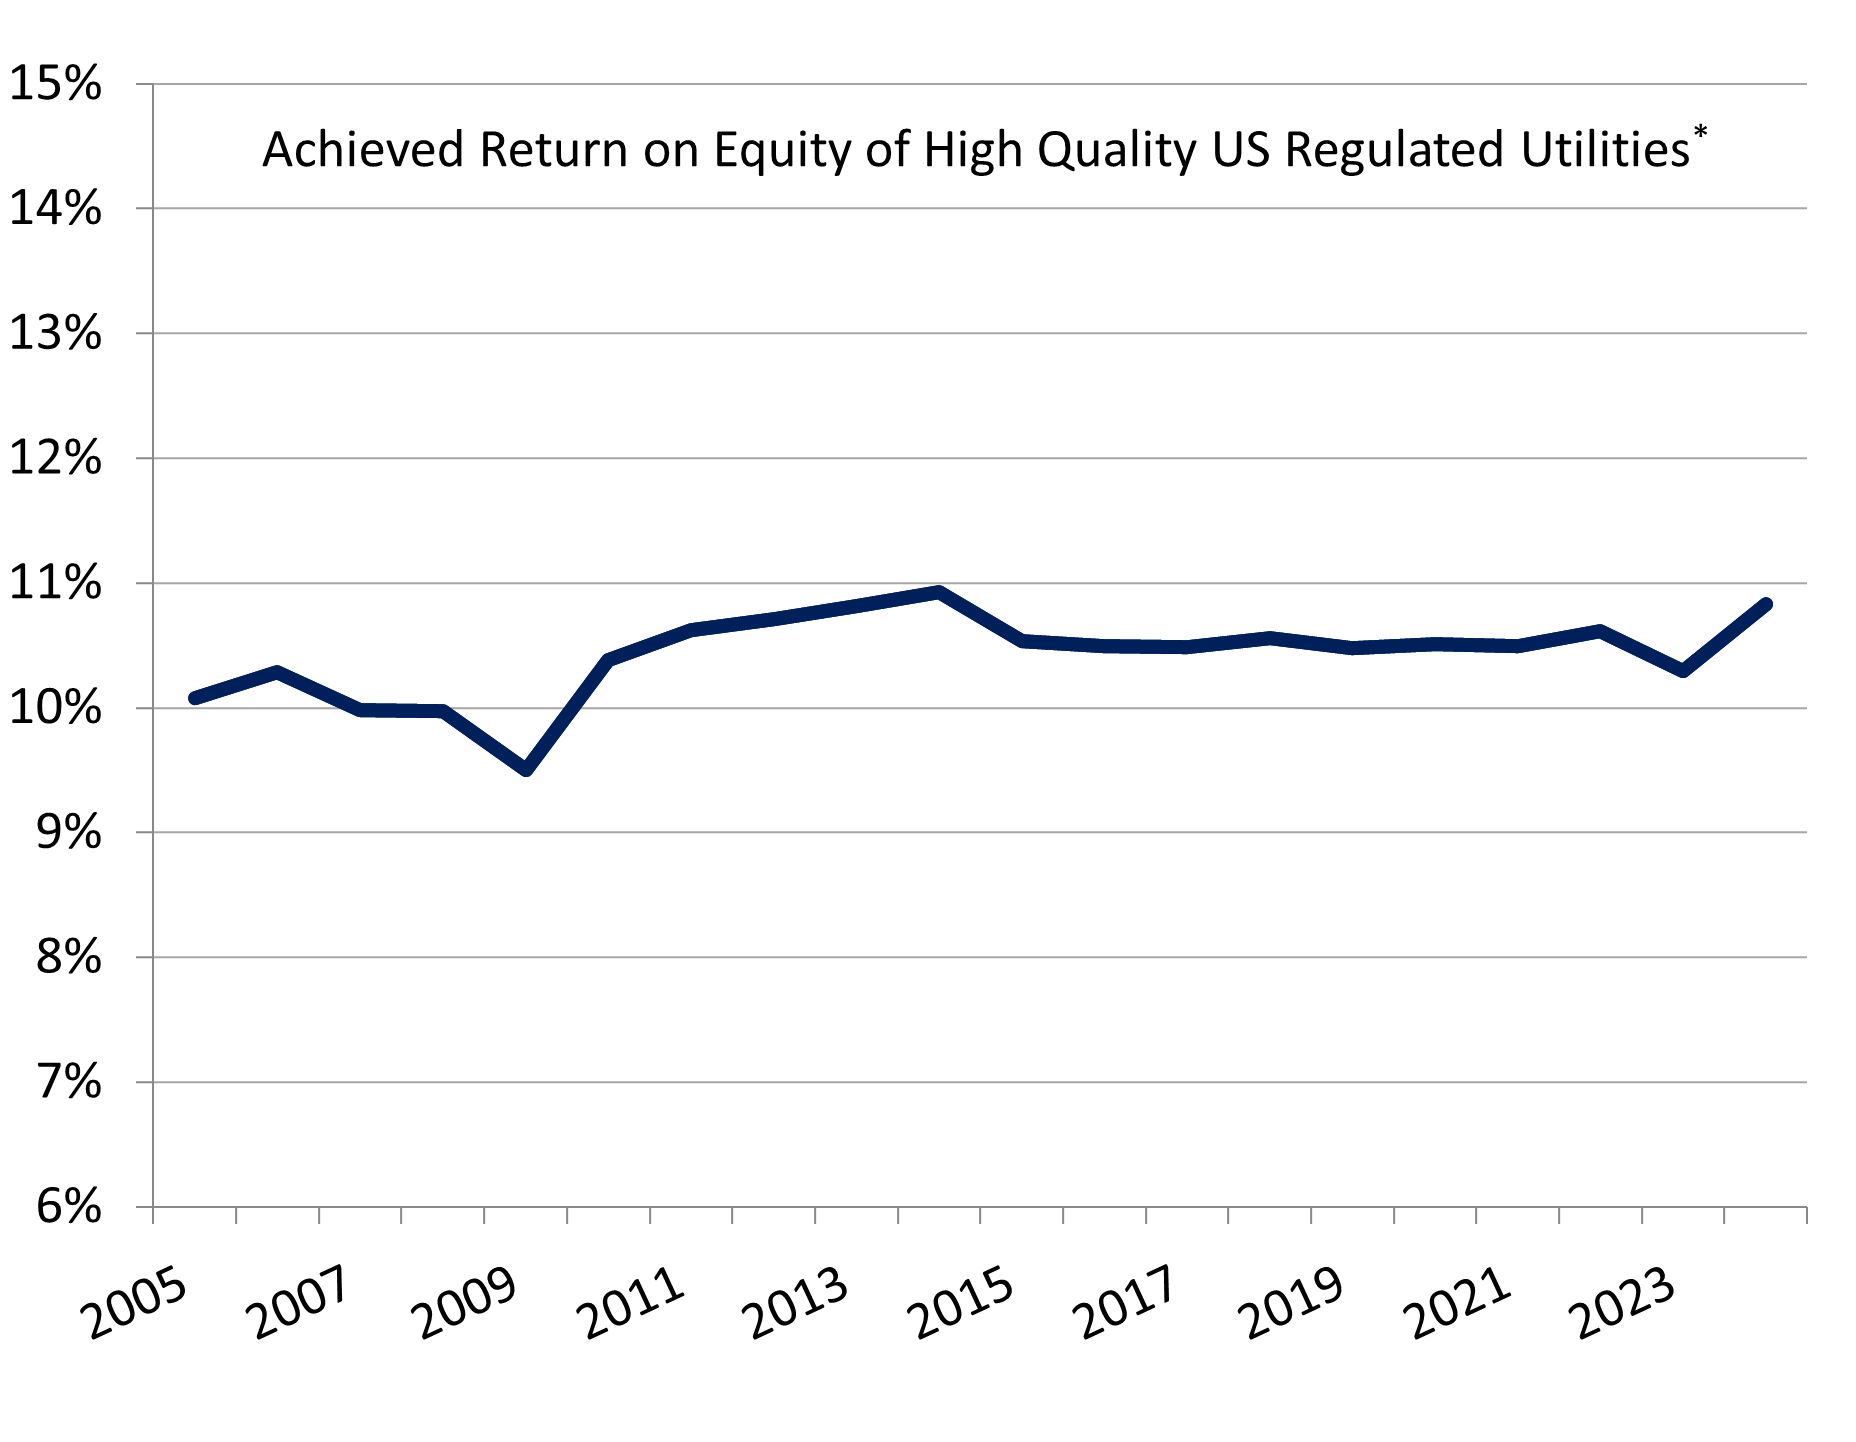
Source: Company disclosures, FactSet, Magellan Investment Partners analysis. *Sample includes Alliant Energy, Atmos Energy, CMS Energy, Consolidated Edison, Evergy, Eversource Energy, Southern Company, WEC Energy, and Xcel Energy.
Regulation: Foundations for recovery
Figure 2 shows an uptick in achieved ROE post-downturn; however, a rising ROE as rates are falling seems at odds with what most people would expect. Over the subsequent few years, in general, awarded ROEs were not cut (they were largely flat or increased slightly) as states with strained fiscal positions looking for ways to stimulate their local economies had a limited set of options. One of these options is to encourage utilities to spend, which is what we see here. It is a win-win, with more jobs and economic activity in the state, no additional strain on public balance sheets and companies who get to grow their capital base – and improve their earnings. The other was the ability of the utilities to contain costs, which became relatively easier as the economy had surplus capacity and rates fell.
As a result, capital investment at regulated utilities is not typically cyclical, with regulators continuing to approve capital expenditure and additional investment proposals over time. This is positive for the recovery and long-term growth outlook for these companies. Given the expected long-term growth in power demand and increasing shifts to clean energy, we would expect this to continue in the coming years, even throughout a recession, should it occur.
Competitive advantage protects earnings
Competitive advantage: Limiting the downside
The reliable demand that flows from the essential service nature of high-quality infrastructure assets combined with profound competitive advantages can also result in highly resilient cash flows during times of economic weakness. Communications infrastructure is one such example of how this can play out. Key examples of communications infrastructure companies include mobile communications infrastructure companies Crown Castle in the US and Spain-based Cellnex, which operates in a number of markets across Europe.
The mobile communications infrastructure is a sector that is well-positioned to continue to benefit from a strong structural demand story. This provides for long-term durability in earnings. With smartphones relatively pervasive in western markets, data traffic demands continue to ratchet higher through increasing applications and data intensity (for example, higher-quality streaming, mobile AI and other platforms) and through an increased rollout of internet-connected devices and mobile fixed wireless. Even if we were to experience a recession, virtually no one is expected to give up their phone. And as data usage continues to grow, so does the need for antennae – and therefore towers on which the antennae are located – to avoid network congestion.
In this sector, the ability of companies to sustain, and increase, earnings growth is also typically underpinned by profound competitive advantages. For communications towers, the business model is for companies to lease space on towers and other structures to mobile network operators. Hand-in-hand with durable demand over the longer term, this leasing model supports resilience in earnings in the short term. Through the leasing model, the tower companies are effectively owners of difficult-to-replicate assets. As a result, while this sector is unregulated, companies face limited competitive threats through a combination of long-term contracts and high switching costs for customers (as switching can sometimes necessitate network redesign). Indeed, customers are locked in with long-term leases with either fixed (typically 2-3%) or inflation-linked price escalators. These companies also have an incumbent advantage through NIMBYism, with approval for new tower infrastructure cumbersome. As a result, the earnings profile for this sector is highly resilient.
Competitive advantage: Foundations for recovery
Holding a clear competitive advantage also gives companies the foundation for solid earnings growth prospects. In the case of communications infrastructure companies, the resilience of cash flows is not dependent on significant capital expenditure programs. For these companies, additional tower tenants add to revenues but incur only limited additional costs. As a result, these companies record rising returns on capital over time, which are not typically cyclical, providing a solid base for long-term growth almost regardless of the economic cycle.
Figure 3 below shows the portfolio yield for US communications infrastructure company Crown Castle as an example, with yield rising steadily over time.
Figure 3: Tower income yields rise steadily over time, supported by competitive advantages
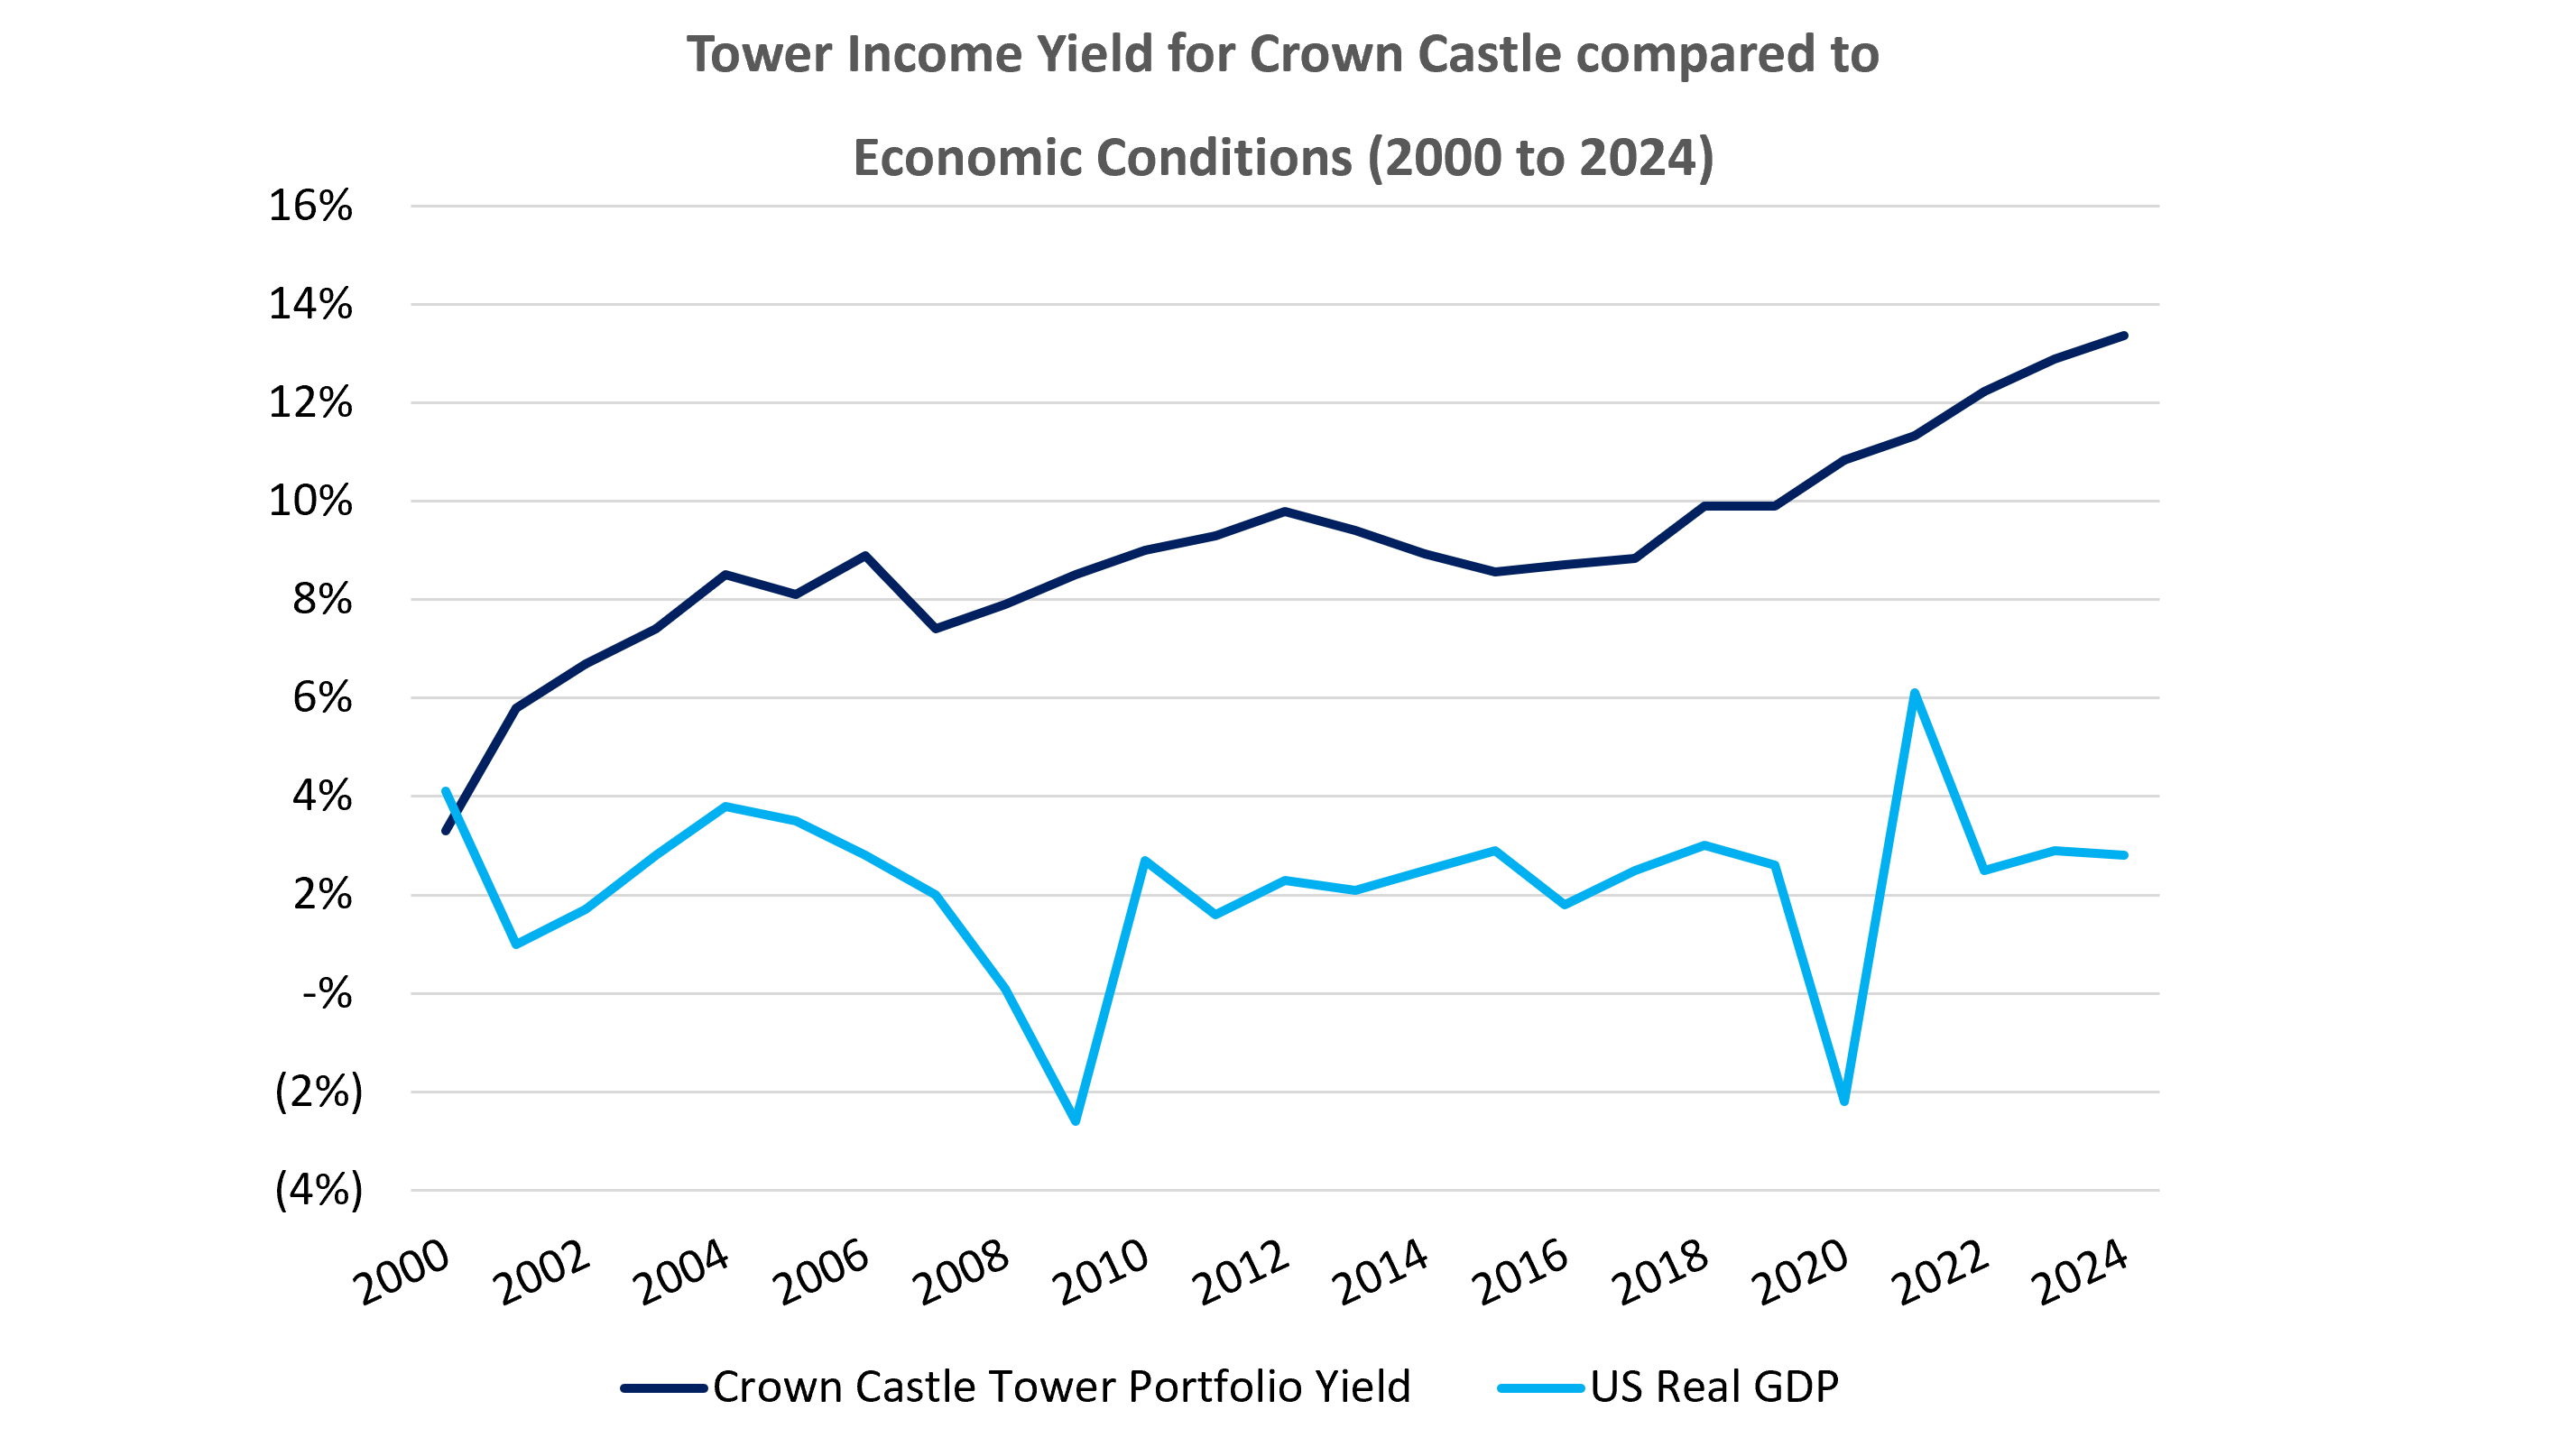
Source: Crown Castle
Secular demand growth drives business activity higher
Secular demand growth: Limiting the downside
Just as communications towers can benefit from structural demand drivers, mobility-linked infrastructure businesses, including toll roads and airports, are also cases in point. Businesses in these sectors can expect to see solid earnings growth over time, as structural demand for these services continues to push higher. This is not to say they are immune to recession, however, though they have typically bounced back more quickly and have seen shallower downturns. Key examples of these companies include Transurban (Australia), Vinci (France), Ferrovial (Netherlands) and Aena (Spain).
Toll roads often have structural demand driven by population growth and economic growth, and often the lack of viable competitive routes, which tend to provide for longer-term tailwinds to growth, with only limited economic exposure at a cash flow level.
We can further segment toll roads into urban (within cities) and inter-urban (between cities) roads. Demand for urban roads is typically highly resilient in a downturn, because most of the traffic is people going about their daily lives – not necessarily people travelling to or from work. For example, in Australia, only around 16% of trips on Transurban roads4 are people commuting for work or study. We saw this play out during the GFC where many urban toll roads continued to grow or had only small declines during the crisis. Figure 4 below shows that for urban roll road operator Transurban, their traffic continued to grow or only fell marginally during the crisis.
Figure 4: Case study: Traffic volume growth on Transurban assets versus global peers during the 2008-09 financial crisis
Traffic growth, %
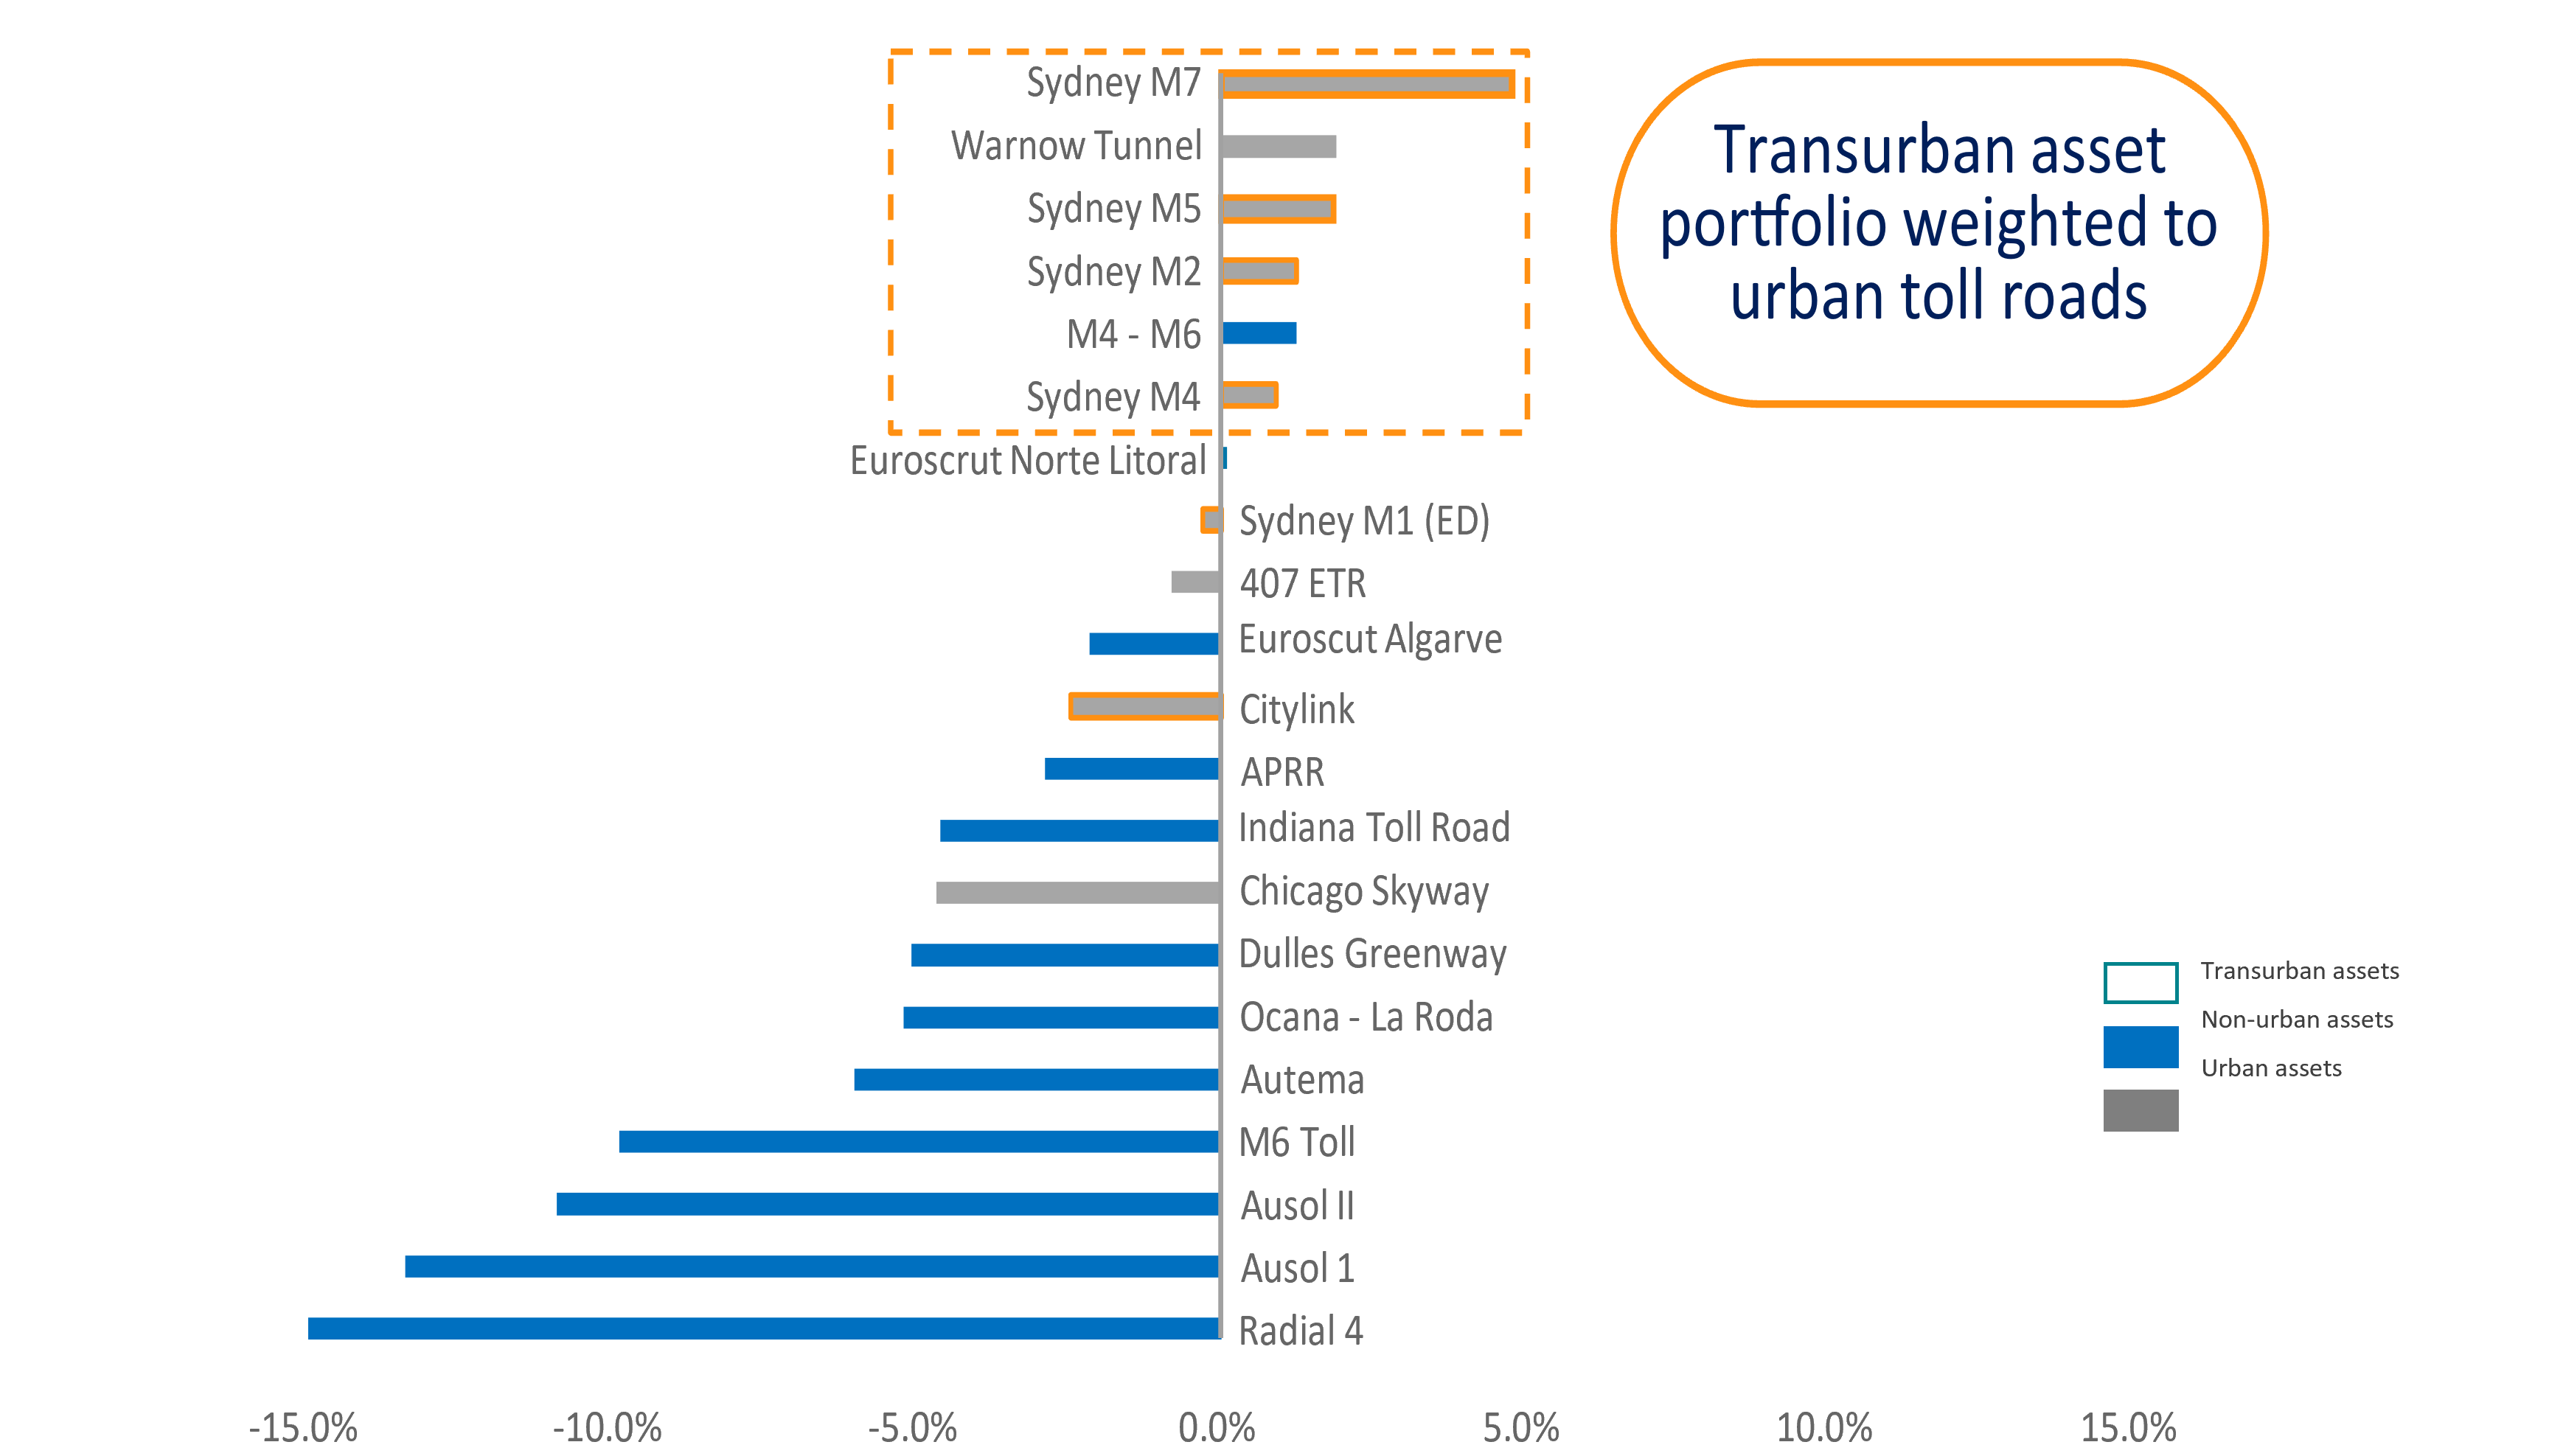
Source: Magellan Investment Partners analysis on data sourced from publicly available presentations, press releases and ASX releases issued by Cintra, Macquarie Atlas Roads and Transurban.
Inter-urban roads generally have more trucks, which makes them slightly more vulnerable to an economic downturn; however, cars make up most of the traffic. This can help compensate in weaker economic times; for example, in the global financial crisis, earnings on these roads continued to grow, as people substituted international holidays for domestic ones, which saw car traffic continuing to grow on some roads. This is reflected in Figure 5, where traffic on Vinci’s main inter-urban road network, ASF, was largely flat in 2008-2009, with light vehicle traffic growth offsetting a 10% drop in heavy vehicle traffic. What is more, when combined with toll increases, ASF EBITDA continued to grow throughout the crisis.
Figure 5: Case study: Vinci inter-urban toll roads traffic
Index (2008=100)
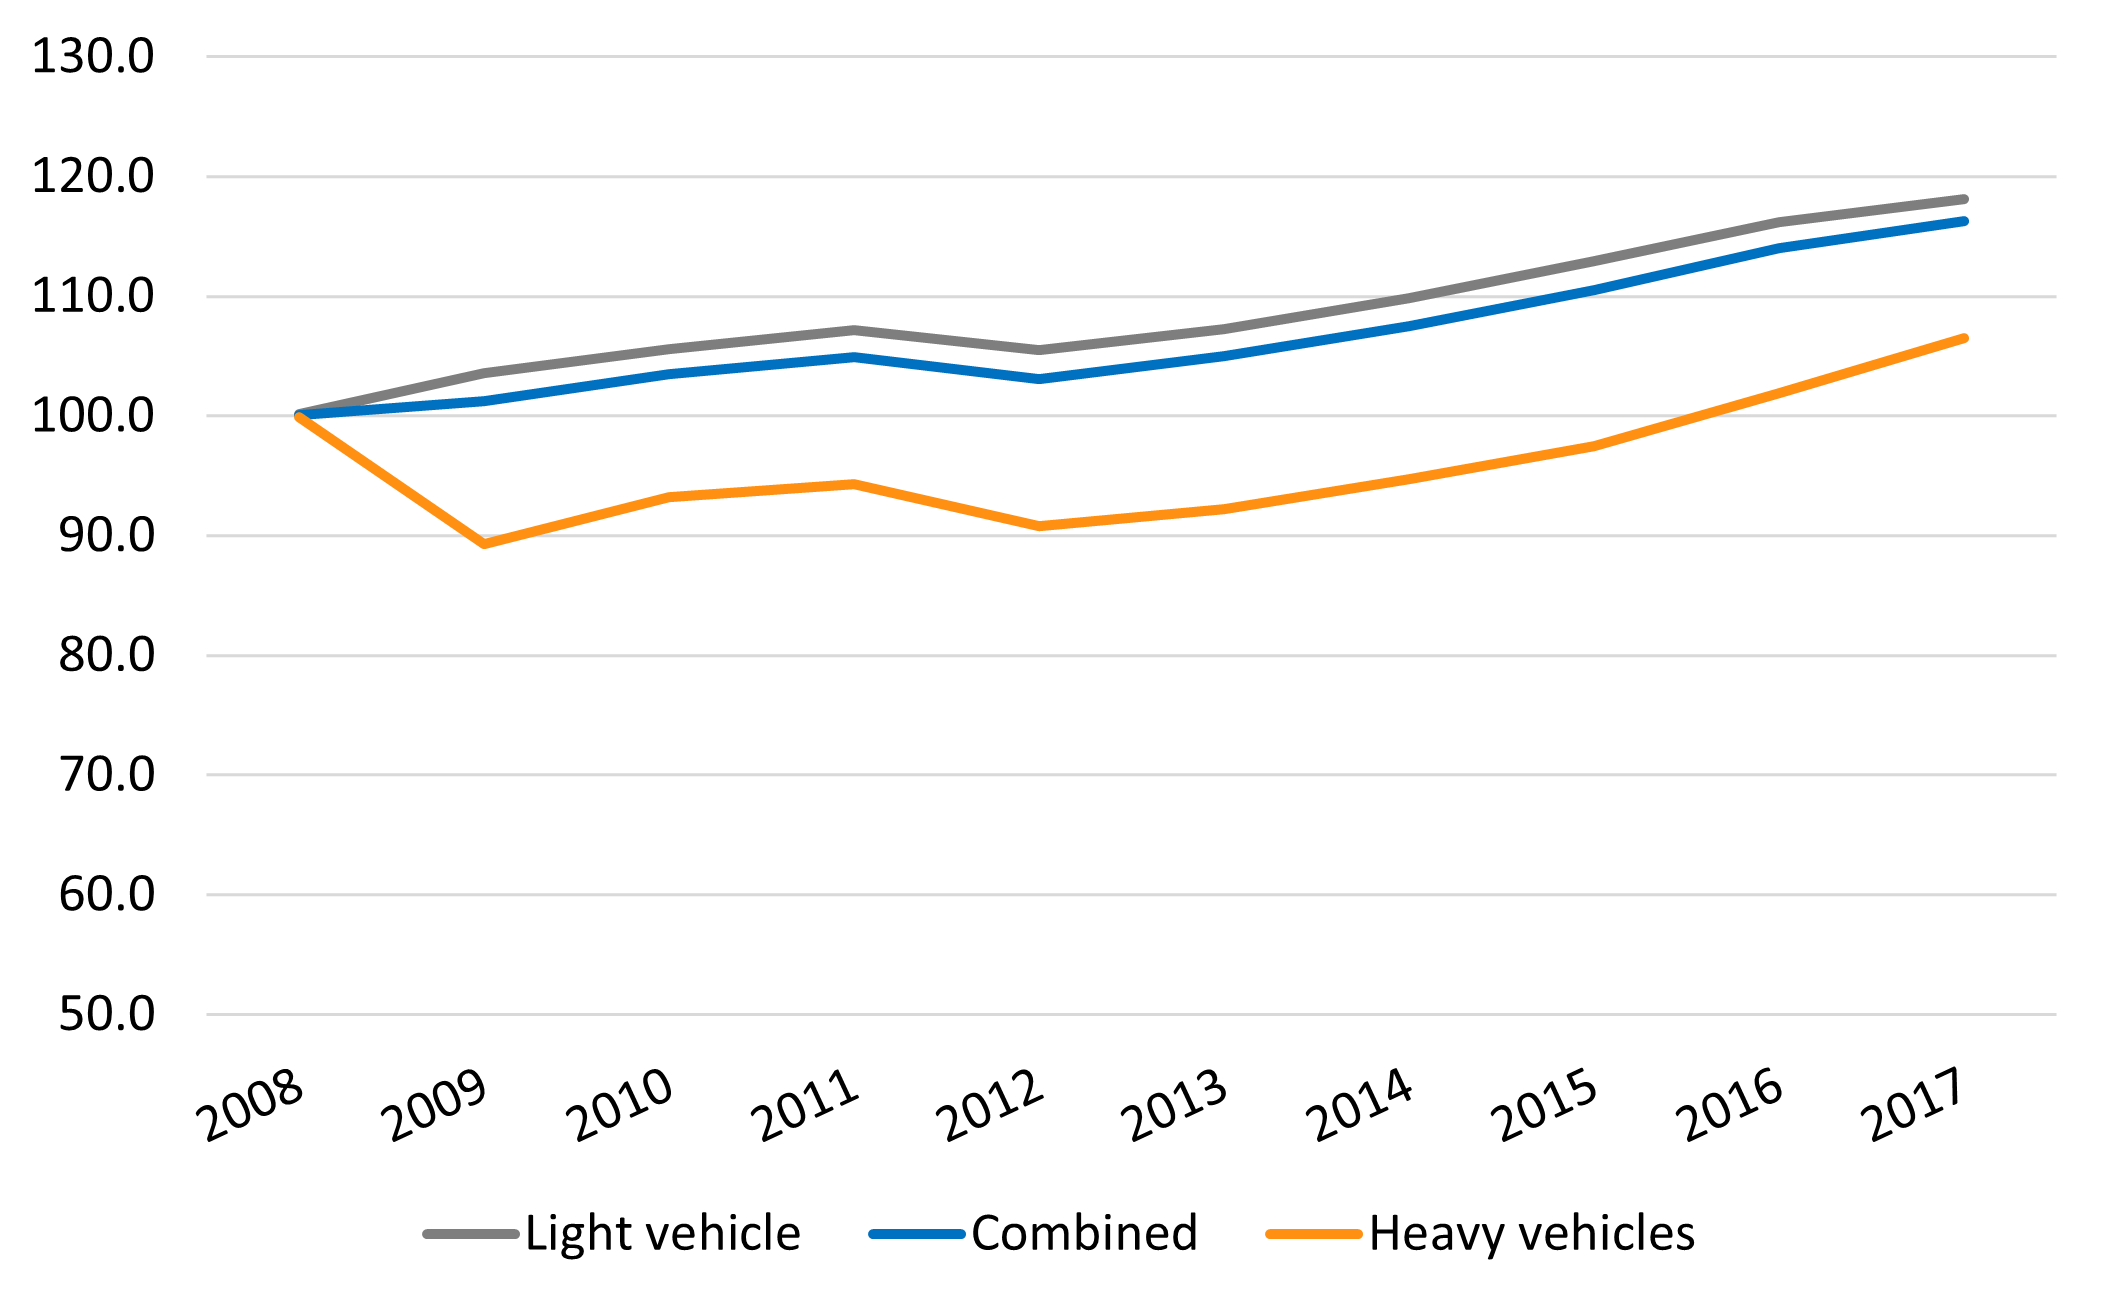
Source: ASFA (French motorways). Index for the combined network in operation as of 1 January three years previously.
As a result, while there can be some near-term variation in activity, over the medium term the structural trends tend to dominate, leading to growing traffic through time. This traffic resilience is complemented by regular toll increases, which also enhance the resilience of overall cash flows.
For airports, the structural demand story is also supportive. Airport passenger volumes have demonstrated a sustained increase over time, driven by population growth, a rising middle class, air route deregulation and the falling costs of air travel. To be clear, air travel, especially leisure travel, is discretionary in nature and is affected by recessions. However, where we have seen impacts in previous downturns, traffic has bounced back quickly – not just to growth, but to trend.
Figure 6 shows that air travel recovered firmly from the Covid-19 shock and continues to expand at a healthy pace. So while we would still expect some impact on air travel if a recession were to occur, all else being equal, we would expect it to be more muted given what we have observed since coming out of Covid. Even in the midst of a cost-of-living crisis in 2022, one key area of consumer discretionary spending that wasn’t being cut was travel. Consumers’ choice to prioritise travel – even if it is shorter trips, or to cheaper destinations – is supportive for airport businesses, as sustained volumes of travellers through an airport are the key for revenues.
Figure 6: Air travel continues to trend higher despite economic shocks

Source: World Bank, IATA, Magellan Investment Partners. *Note that 2022- 2025 are based on Revenue Passenger Kilometres.
Secular demand growth: Foundations for recovery
Given demand for roads and airports should follow a sustained, upward trend over many years, capital spending programs for businesses in these sectors can be expected to continue in a downturn, which is supportive for future growth. For toll roads, we have previously seen governments using these assets to stimulate local economies in recession by supporting capital works programs. Over time, these works ultimately enhance value, and their cost can be recovered through toll increases and/or concession extensions.
For airports, airlines continue to work through supply chain and regulatory/safety issues that have constrained production of aircraft over the last few years. This means that we would expect to see a continued ramp-up in aircraft deliveries over the next few years, particularly as Boeing comes up to full production and Airbus works through an engine availability issue. This additional capacity, as well as the fact that newer jets are more fuel-efficient and hence cheaper to run, should ultimately lead to lower ticket prices. Lower prices should also help to soften any impacts from recession – particularly when combined with consumers’ clear preference to keep travelling.
Market power drives pricing growth
Market power: Limiting the downside
A further defining characteristic of the essential services that some infrastructure companies provide is market power. The provision of a basic but critical service through a network or to a large population has
inherently high barriers to entry. As a result, a company providing such essential services is also a market maker. Rail is one such example5.
Rail historically has been shown to be more economically sensitive than other defensive infrastructure assets, with volumes typically declining in periods of economic decline. However, rail companies can offset softer demand in a downturn somewhat by increasing prices. Because these companies provide substantial network infrastructure that cannot be replaced, demand is relatively insensitive to an uptick in pricing. Rail customers are also typically looking to transport large volumes over a long distance (such as grain, cars), where there is no easy alternative, such as trucking. These companies can generate real price growth as a result, as shown in Figure 7.
Figure 7: Rail infrastructure companies can drive real pricing power, which is a key earnings driver
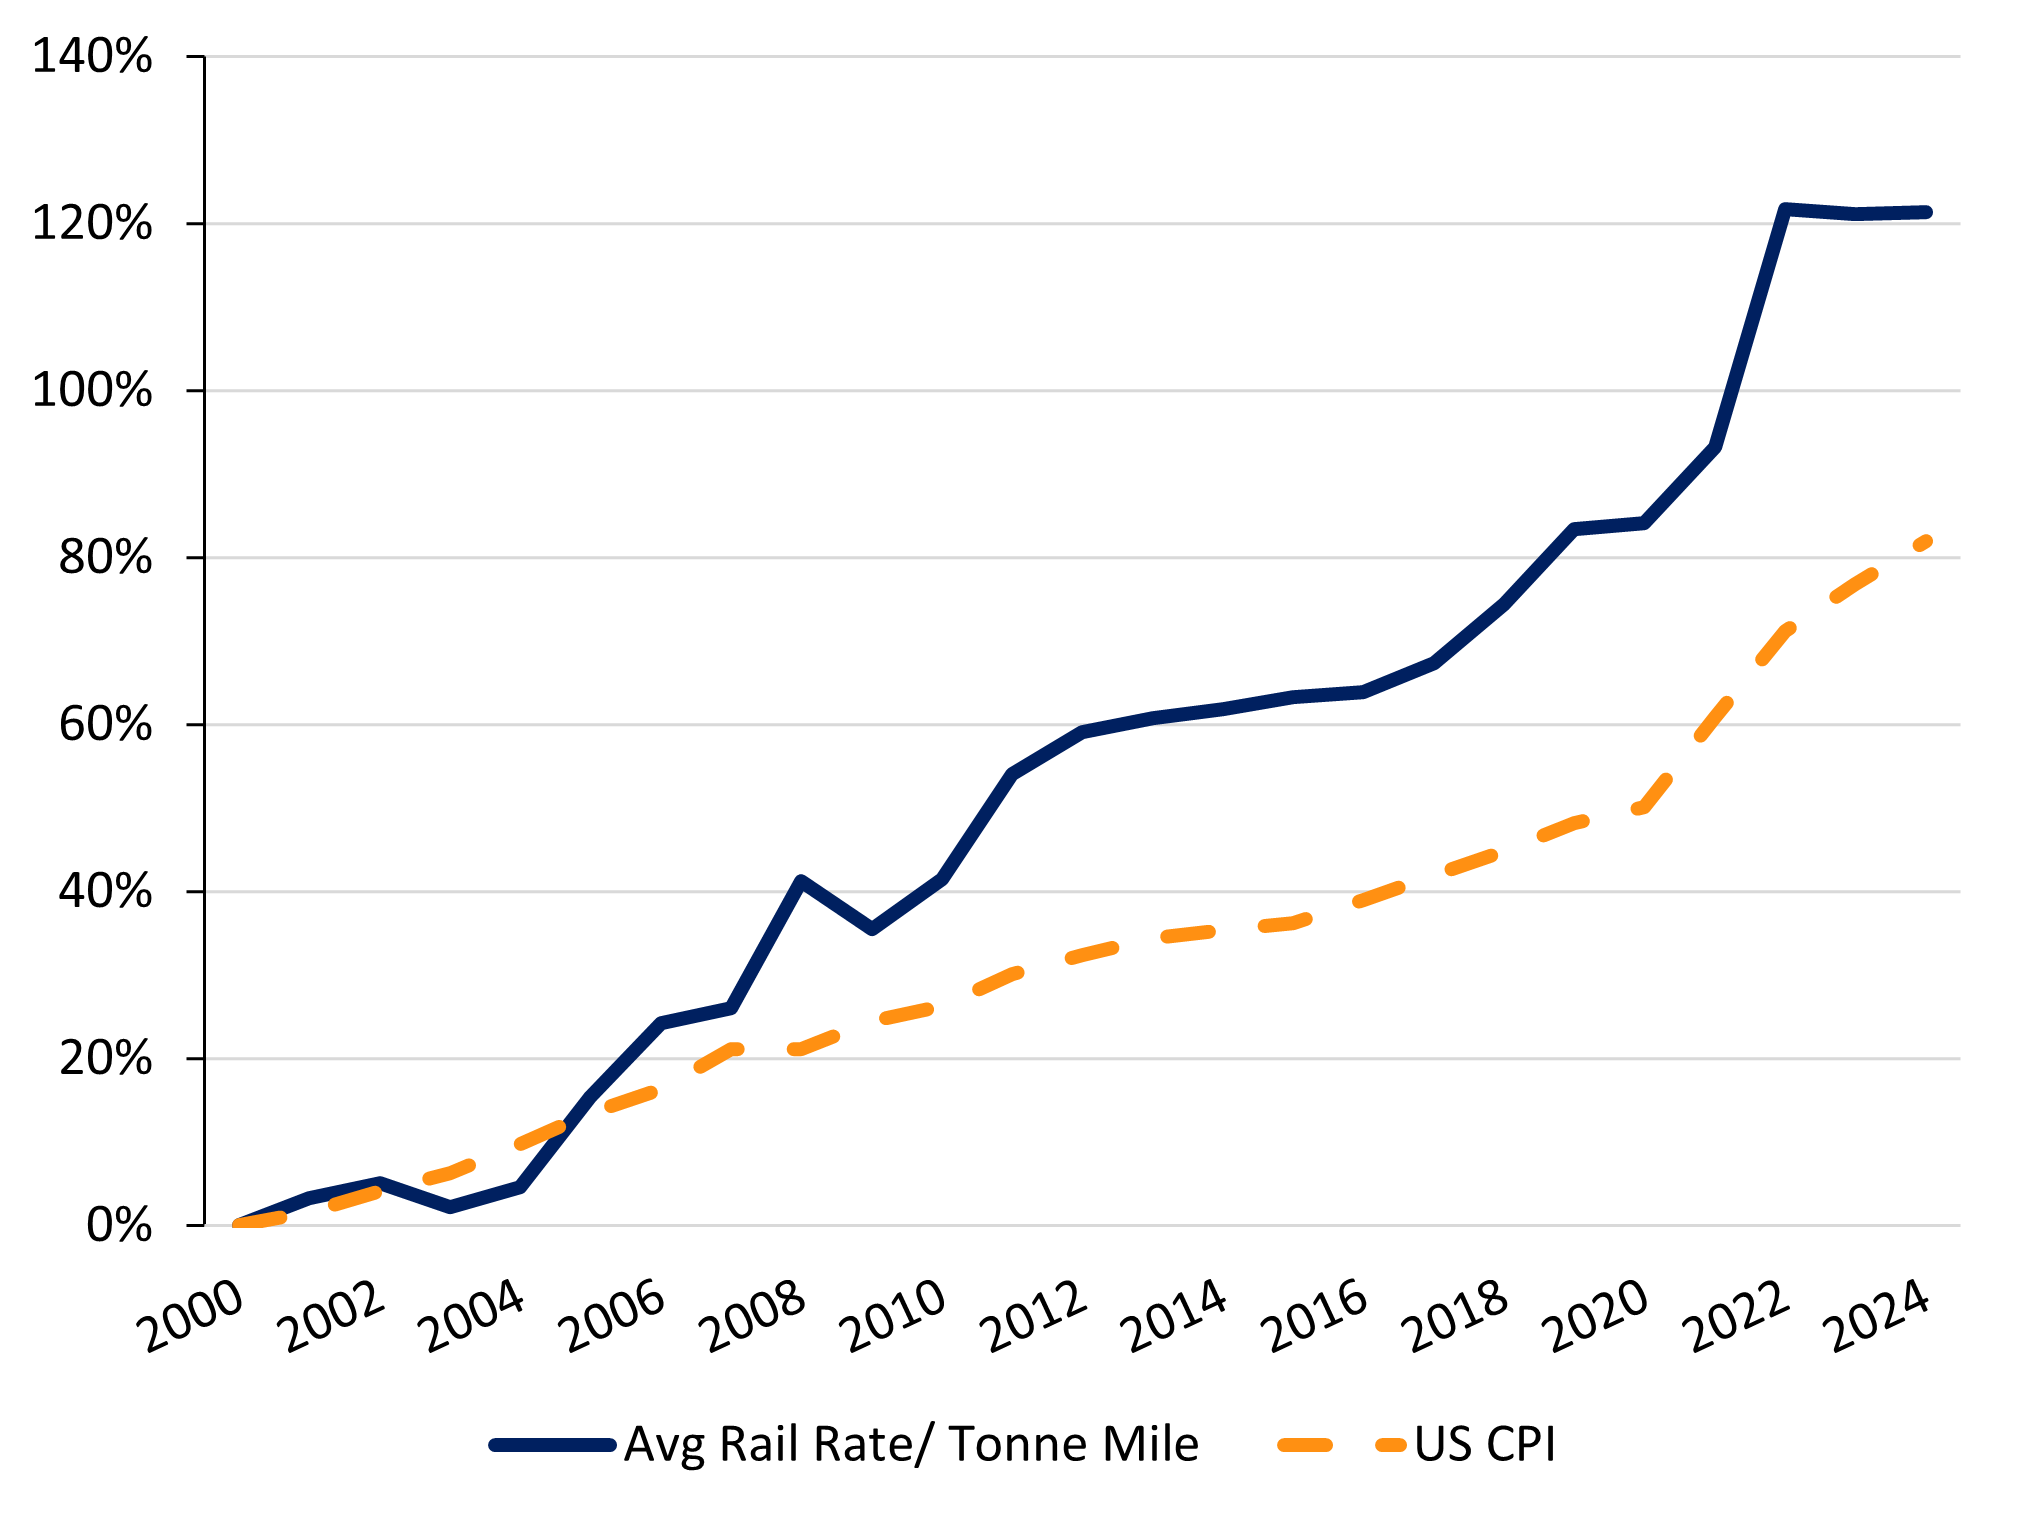
Source: Bureau of Labor Statistics, US Federal Reserve, Listed Class 1 Company Data, Magellan Investment Partners analysis.
Market power: Foundations for recovery
With the ability to set pricing, rail companies can weather weaker demand temporarily. This earnings cover also provides space for companies to make improvements to their operations or invest in their capital stock, so that they are better positioned over the longer term. For example, investments in operational efficiency, including through technology, can improve productivity. Historically we have observed that the efficiencies realised from investments in precision scheduling have supported resilient cash flows through a downturn. Such investment now is self-reinforcing for earnings, as it can support better service outcomes.
Testing the mettle on infrastructure performance
When conditions get tough, infrastructure companies can lean into the benefits provided by regulation, competitive advantages, strong secular demand and market power that characterise their operating environment. With reliable demand and predictable earnings, high-quality listed infrastructure is expected to prove resilient throughout an economic downturn.
This is not to say that the near-term outlook is without challenges. The key risk to monitor is a significant global recession. In this situation, all sectors, including infrastructure, would be affected. Nonetheless, the core drivers that make infrastructure a quality, defensive option would be expected to come into play. Limiting the downside risk and a solid basis for rebound in the recovery are core attributes that should come to bear in such an environment. Furthermore, real interest rates often fall in a recession, which is ultimately supportive of valuations for listed infrastructure businesses.
Resilient through recession and beyond
The near-term outlook for markets is clouded with uncertainty, including the timing, depth or duration of any downturn. This is the time for investors to take a step back and explore opportunities to strengthen overall portfolio diversification rather than react to the noise.
High-quality infrastructure companies can offer reliable demand, predictable earnings and defensive positioning, even in a downturn. At Magellan Investment Partners our listed infrastructure strategy is grounded in a proven, disciplined approach; investing in companies that deliver essential services, possess clear competitive advantages, and benefit from structural demand growth and pricing power. We believe our approach not only offers resilience in times of market stress, but also makes listed infrastructure a valuable component of a well-diversified portfolio over time.
Magellan Global Listed Infrastructure Team
*Dislaimer reference to Figure 1: Data source: Bloomberg, Magellan. Equity market drawdowns are defined as events where the MSCI World NTR Index (A$ Hedged)+ has declined by 5% or more. The majority of downturns are led by economic activity, not rates.
The Global Infrastructure Benchmark is the S&P Global Infrastructure NTR Index (A$ Hedged) spliced with the UBS Developed Infrastructure & Utilities Index NTR (A$ Hedged) prior to 1 January 2015.
The numerical information in Figure 2 is based on a representative portfolio. The representative portfolio is an account in the Global Core Infrastructure (Hedged AUD) Composite that closely reflects the portfolio management style of the strategy and denoted in AUD after fees. Performance would vary if returns were denominated in a currency other than AUD. Performance is not a consideration in the selection of the representative portfolio. The characteristics of the representative portfolio may differ from those of the composite and of the other accounts in the composite. Composite (Net) returns are net of fees charged to clients and have been reduced by the amount of the highest fee charged to any institutional client employing that strategy during the period under consideration. Actual fees may vary depending on, among other things, the applicable fee schedule and portfolio size. Fees are available upon request. Inception date is 17 December 2009.
+All MSCI data used is the property of MSCI. No use or distribution without written consent. Data provided “as is” without any warranties. MSCI and its affiliates assume no liability for or in connection with the data. Please see complete disclaimer in www.magellangroup.com.au/funds/benchmark-information/.
Magellan Global Listed Infrastructure Team
1 A decline of more than 5% in the MSCI World NTR Index (A$ Hedged)+
2 S&P Global Infrastructure Index. Analysis refers to the MFG Core Infrastructure Strategy. This series is hedged in AUD to disaggregate the asset impacts from the currency impacts on downside capture.
3 Data source: United States Energy Information Administration
4 Data source: Transurban
5 Rail is not currently included in the MFG Core Infrastructure Strategy. It is a component of the MFG Select Infrastructure Strategy.
Important Information: This material is not intended to constitute advertising or advice of any kind and you should not construe the contents of this material as legal, tax, investment or other advice. In making an investment decision, you should read and consider any relevant offer documentation applicable to any investment product or service and must rely on your own examination of the same and consider obtaining professional investment advice tailored to your specific circumstances before making any investment decision.
The investment program of the strategy or strategies presented herein (‘Strategy’) is speculative and may involve a high degree of risk. The Strategy is not intended as a complete investment program and is suitable only for sophisticated investors who can bear the risk of loss. The Strategy may lack diversification, which can increase the risk of loss to investors. The Strategy’s performance may be volatile. Past performance is not necessarily indicative of future results and no person guarantees the future performance of the Strategy, the amount or timing of any return from it, that asset allocations will be met, that it will be able to implement its investment strategy or that its investment objectives will be achieved. Statements contained in this material that are not historical facts are based on current expectations, estimates, projections, opinions and beliefs and such statements involve known and unknown risks, uncertainties and other factors, and undue reliance should not be placed thereon. This material may contain ‘forward-looking statements’. Actual events or results or the actual performance of the Strategy or any financial product or service may differ materially from those reflected or contemplated in such forward-looking statements. The Strategy will have limited liquidity, no secondary market for interests in the Strategy is expected to develop and there are restrictions on an investor’s ability to withdraw and transfer interests in the Strategy. The management fees, incentive fees and allocation and other expenses of the Strategy will reduce trading profits, if any, or increase losses.
No representation or warranty is made with respect to the correctness, accuracy, reasonableness or completeness of any of the information contained in this material. This information is subject to change at any time and no person has any responsibility to update any of the information provided in this material. This material may include data, research and other information from third party sources. No guarantee is made that such information is accurate, complete or timely and no warranty is given regarding results obtained from its use. The issuer of this material and its related entities and affiliates will not be responsible or liable for any losses, whether direct, indirect or consequential, including loss of profits, damages, costs, claims or expenses, relating to or arising from your use or reliance upon any part of the information contained in this material including trading losses, loss of opportunity or incidental or punitive damages.
This material and the information contained within it may not be reproduced, or disclosed, in whole or in part in any circumstances. , Further information regarding any benchmark referred to herein can be found at www.magellaninvestmentpartners.com/funds/benchmark-information/. Any third-party trademarks contained herein are the property of their respective owners and are used for information purposes and only to identify the company names or brands of their respective owners. (080825-#i1)
United Kingdom: This material has been prepared by Magellan Asset Management Limited (ABN 31 120 593 946 AFSL 304 301) doing business as Magellan Investment Partners and is distributed in the United Kingdom by Magellan Investment Partners (UK) Limited (FRN: 1037936), an appointed representative of Sentinel Regulatory Services Ltd (FRN: 1007093) which is authorised and regulated by the Financial Conduct Authority. This material does not constitute an offer or inducement to engage in an investment activity under the provisions of the Financial Services and Markets Act 2000 (FSMA). This material does not form part of any offer or invitation to purchase, sell or subscribe for, or any solicitation of any such offer to purchase, sell or subscribe for, any shares, units or other type of investment product or service. This material or any part of it, or the fact of its distribution, is for background purposes only. This material has not been approved by a person authorised under the FSMA and its distribution in the United Kingdom and is only being made to persons in circumstances that will not constitute a financial promotion for the purposes of section 21 of the FSMA as a result of an exemption contained in the Financial Services and Markets Act 2000 (Financial Promotion) Order 2005 (FPO) as set out below. This material is exempt from the restrictions in the FSMA as it is to be strictly communicated only to ‘investment professionals’ as defined in Article 19(5) of the FPO.
United States: This material has been prepared by Magellan Asset Management Limited (ABN 31 120 593 946 AFSL 304 301) doing business as Magellan Investment Partners (‘Magellan’) which is a registered investment adviser. The investment strategies described herein are distributed in the United States by Frontier Partners, Inc. (‘Frontier’), a U.S.-registered investment adviser. For the purposes of the US Securities Act 1933, Magellan and Frontier are affiliated entities. Registration as an investment adviser does not imply any level of skill or training. This material is not intended as an offer or solicitation for the purchase or sale of any securities, financial instrument or product or to provide financial services. It is not the intention of Magellan to create legal relations on the basis of information provided herein. Past performance does not guarantee future results. Where performance figures are shown net of fees charged to clients, the performance has been reduced by the amount of the highest fee charged to any client employing that particular strategy during the period under consideration. Actual fees may vary depending on, among other things, the applicable fee schedule and portfolio size. Fees are available upon request and also may be found in Part II of Magellan’s Form ADV.
Canada: This material is provided to you by Magellan Asset Management Limited (ABN 31 120 593 946 AFSL 304 301) doing business as Magellan Investment Partners (‘Magellan’). Magellan is not registered in any province in Canada. The head office of Magellan is in Sydney, Australia and all or substantially all of its assets are situated outside of Canada. Due to the foregoing, there may be difficulty enforcing legal rights against Magellan.
South Africa: This material is provided to you by Magellan Asset Management Limited (ABN 31 120 593 946 AFSL 304 301) doing business as Magellan Investment Partners, who in accordance with FAIS Notice 55 of 2023 issued by the Financial Sector Conduct Authority, Magellan Investment Partners is exempted from section 7(1) of the Financial Advisory and Intermediary Services Act, 2002 (Act No. 37 of 2002). This material is not an offer in terms of Chapter 4 of the Companies Act, 2008.
UAE: This material has been produced by Magellan Asset Management Limited (ABN 31 120 593 946 AFSL 304 301) doing business as Magellan Investment Partners. This material is not for distribution to any other person. This material, and the information contained herein, does not constitute, and is not intended to constitute, a public offer of securities in the United Arab Emirates (‘UAE’) and accordingly should not be construed as such. Any offer of securities or financial services is made only to a limited number of exempt Professional Investors in the UAE who fall under one of the following categories: federal or local governments, government institutions and agencies, or companies wholly owned by any of them.
No securities or services have been approved by or licensed or registered with the UAE Central Bank, the Securities and Commodities Authority, the Dubai Financial Services Authority, the Financial Services Regulatory Authority or any other relevant licensing authorities or governmental agencies in the UAE (the ‘Authorities’). The Authorities assume no liability for any investment that the named addressee makes as a Professional Investor. This material is for the use of the named addressee only and should not be given or shown to any other person (other than employees, agents or consultants in connection with the addressee’s consideration thereof).
Other jurisdictions: This material is provided to you by Magellan Asset Management Limited (ABN 31 120 593 946 AFSL 304 301) doing business as Magellan Investment Partners. No distribution of this material will be made in any jurisdiction where such distribution is not authorised or is unlawful. This material does not constitute, and may not be used for the purpose of, an offer or solicitation in any jurisdiction or in any circumstances in which such an offer or solicitation is unlawful or not authorized or in which the person making such offer or solicitation is not qualified to do so.
UID084