Quality in action: the importance of specialist investment in listed infrastructure

The importance of investing in quality companies is a longstanding, core principle for fundamental investors. Identifying quality companies with resilient business models, strong financial foundations and competitive market positions, capable of withstanding downturns and quickly returning to growth in upturns is highly desirable from an investment perspective. This is no truer than at the start of 2026, where markets remain volatile against a backdrop of escalating geopolitical risks and question marks on the durability of the 2025 global share market rally, with its underlying AI thematic.
Investors in quality infrastructure seek the key benefits of portfolio diversification, stable cash flows, a degree of inflation protection and real earnings growth over time. These benefits are powerful drivers of portfolio returns over the long term. Identifying quality infrastructure companies requires specialist understanding of the sector. In our view, it is when the infrastructure universe is tightly defined and a disciplined process is applied to investing in these assets, that these quality attributes can be best accessed. Without this specialist focus, investors may overlook quality opportunities and allocate capital to assets that appear to be infrastructure but ultimately behave very differently from an investor’s expectations.
The quality opportunity in listed infrastructure starts with definition
Infrastructure cuts across multiple diverse sub-sectors. For example, the table shows the nine key sub-sectors of the MFG Core Infrastructure strategy.
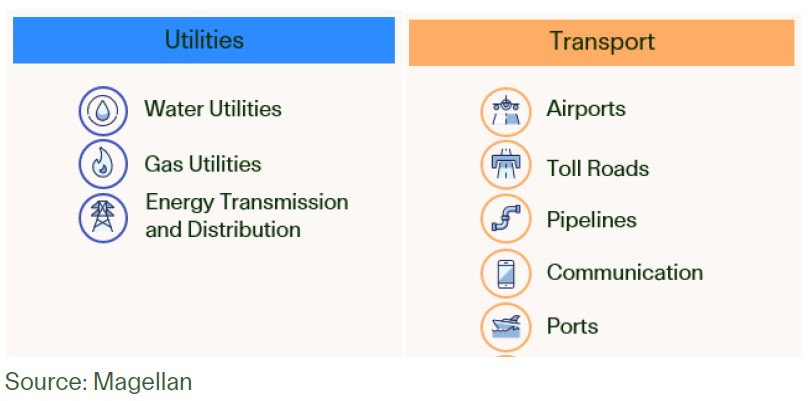
With such a broad opportunity set, what is considered infrastructure varies significantly between specialist investors and other market participants. Index to index and manager to manager, the listed infrastructure universe can be quite different. For example, consider two major listed infrastructure indices, the S&P Global Infrastructure Index (“S&P Index”) and the FTSE Core 50/50 Developed Index (“FTSE Index”). While the S&P Index captures a subset of the universe, the FTSE Index is a more broad-based construction. Comparing the sector breakdown for these two indices illustrates that infrastructure, even as it is captured at an index level, can be variable. This reflects the diverse businesses that fall under the infrastructure umbrella. There are notable differences in composition between these two major indices across commodity-price exposed and competition-exposed infrastructure companies as well as across airports, toll roads and rail.
Major index weights in infrastructure subsectors
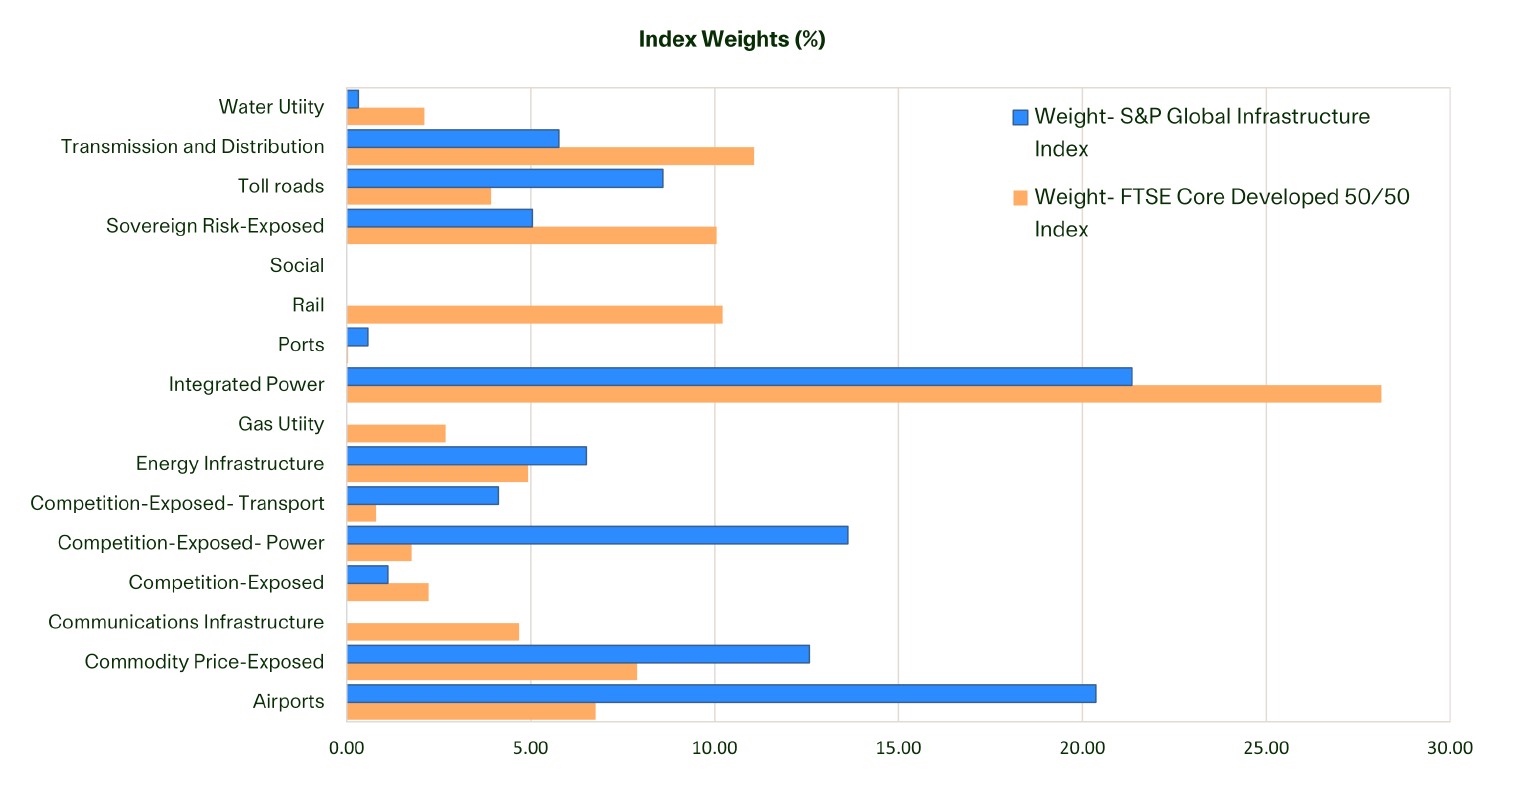
Source: FTSE, S&P, Magellan analysis
These examples illustrate the broad and diverse nature of the infrastructure universe, with nearly 25% of the S&P and FTSE index weights not overlapping and each index exhibiting a distinct composition. As a result, a wide range of very different businesses, with distinct investment characteristics, are classified as ‘infrastructure’. This is important because, ultimately, how listed infrastructure is defined can have a significant impact on the risk/return characteristics of an infrastructure investment. This suggests that a generalist view of infrastructure risks oversimplification and may not unpack the specific risks and opportunities in each subsector that drive long-term returns.
Comparing the breakdown of the MFG Core Infrastructure strategy with the S&P Index highlights the differences between specialist and generalist definitions of infrastructure.
We note that there is concentration in the infrastructure benchmark in commodity-price-exposed companies, such as oil and gas pipeline companies (where a substantial proportion of their earnings is tied to commodity prices), and in those companies with undue exposure to competition, such as merchant generators. We also note exposure to businesses operating in higher-risk sovereignties, such as non- OECD jurisdictions, including China. At the same time, the S&P Index has almost no exposure to some fundamental infrastructure sectors including Gas and Water. In contrast, the MFG Core Infrastructure strategy screens out businesses with undue exposure to commodity prices, competition and sovereign risk. Instead, the strategy focuses on investing in ‘core’ infrastructure businesses, including integrated power, transmission and distribution, toll roads and communications infrastructure, to generate durable returns.
MFG Core Infrastructure Strategy weighs in key infrastructure sub sectors compared to index weights
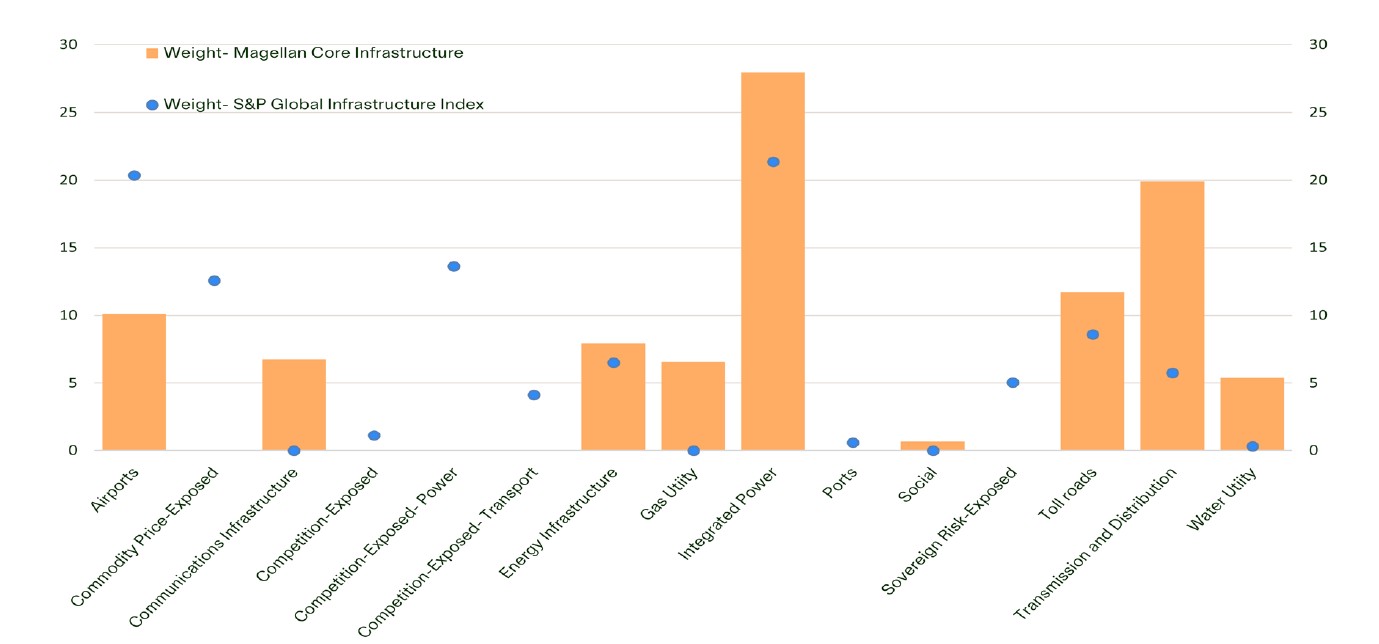
Source: S&P, Magellan analysis
The strategy and index weights comparison chart exemplifies a specialist view of infrastructure in action. A disciplined definition frames the investment universe from the outset and provides a differentiated opportunity set. This matters to investors because it leads to meaningful differences in how companies perform through economic cycles and in the expected durability of their returns. As highlighted on the right, defining the infrastructure universe tightly is a critical first step in identifying reliable, quality infrastructure companies.
A specialist approach goes deeper on quality listed infrastructure
In refining the scope of acceptable listed infrastructure companies, a clear definition is the foundation for investing in quality businesses in this asset class. Having a well-defined potential set of companies on which to focus sets the stage for a disciplined investment process to follow.
In our view, quality is then driven by the underlying asset economics of an infrastructure business, as these characteristics determine a company’s ability to weather tough conditions and thrive when the economic cycle turns up. This is at the centre of a specialist approach to infrastructure investing, as it requires a deep understanding of the economic models across the key subsectors, along with detailed knowledge of specific companies within a given group.
Consider a sample of companies from the S&P Index, in which the Index has a 0% weight, however are among the largest holdings in the MFG Core Infrastructure strategy. These companies demonstrate high-quality attributes, as shown in the case studies on the following pages. They are also significant contributors to total return for the MFG Core Infrastructure strategy in recent years. Investing in these companies, or in strategies that hold them, has therefore presented a quality opportunity for investors that may have otherwise been overlooked by simply following an index.
The Magellan Infrastructure Definition
Our definition focuses on two core characteristics of true infrastructure assets, which support their distinct performance through economic cycles:
Highly reliable demand
Highly reliable cash flows
For many investment managers, screening companies on the reliability of their demand is a key step, but not the only step in defining an ‘infrastructure’ company. For example, companies that provide essential services to the community such as water and electricity infrastructure companies are widely regarded as infrastructure.
We view the reliability of cash flows as an equally crucial second step in evaluating companies for their suitability. This includes screening companies for undue exposure to commodity prices, competitive pressures and undue sovereign risk.
Looking at electricity infrastructure, we consider regulated utilities that provide an essential service and generate predictable cash flows to be infrastructure. These businesses typically operate in a monopoly-like structure and earn an agreed regulated return on their assets. Companies such as Xcel Energy or WEC Energy in the US and the water utility Severn Trent in the UK are examples. However, we do not consider merchant generators or ‘gentailers’ (companies that combine generation and retail, such as AGL and Origin in Australia) as meeting our definition of infrastructure. Though these businesses provide electricity, which is an essential service with predictable demand, they are beholden to market price pressures in competitive retail markets. This is an important point of difference, as it speaks to a company’s ability to act in a differentiated, dependable way through a business cycle; for example, by continuing to grow margins, collect cash and provide yield to investors.
Ferrovial
Flagship concession assets in high-density markets: Ferrovial is a multinational infrastructure company with core operations in toll roads and airports, alongside construction and services businesses. Within its infrastructure division, North American toll roads are the most significant contributor, highlighted by its flagship investment in Toronto’s 407 ETR and its managed lanes network across the United States. The company also has a presence in airports, with investments in major global hub JFK in New York.
Exemplary pricing power: The 407 ETR in Canada is arguably one of the most attractive toll road concessions in the market, with Ferrovial holding a 48.29% stake. In recent years, the company implemented mid-teens toll increases. Market conditions and the positioning of the asset provide for such robust pricing power. The road runs across northern Toronto, with Highway 401 as the main alternative route. The 401 is often regarded as the busiest highway in North America and experiences significant congestion. In addition, the 407 ETR operates under a long-term contract that extends to 2098 and toll price increases have few restrictions – with no specific cap on toll prices as long as traffic remains above specified levels. The pricing flexibility is key and stands in contrast to many toll roads that have more restrictive pricing clauses embedded in their contracts. We believe traffic conditions should remain favourable, supported by positive migration trends, a solid economic outlook, and the road’s role as a key corridor across densely populated areas of Toronto. Lake Ontario to the south limits the development of effective competing routes.
Ownership stakes in additional assets with good operating leverage: The company has been growing its business throughout the US by developing its high-occupancy toll lanes (‘HOT’ lanes) or managed lanes. The distinguishing feature of these HOT lanes is their use of dynamic pricing. This means that to guarantee and maintain a minimum average speed, the tolls are automatically adjusted higher as the speed of vehicles drops towards the minimum threshold. Users are charged based on their marginal willingness to pay, rather than a cap set by the concession grantor. While this can lead to high tolls at certain periods, some feedback suggests customer satisfaction is higher when tolls are higher, as it means the competing free road is heavily congested and therefore the time savings are even greater. The company operates a portfolio of managed lanes, including key assets in the fast-growing region of Dallas-Fort Worth, Texas, Charlotte, North Carolina and in a highly congested yet affluent area of Virginia that serves traffic heading to Washington D.C. We believe that the success of Ferrovial’s HOT lanes and its innovative, world-leading dynamic pricing model demonstrates the company’s strong IP and competitive advantage.
Cellnex
Cellnex is the largest tower company in Europe, owning or managing approximately 111,000 towers, largely across five core markets: Spain, Italy, France, the United Kingdom and Poland.
Predictable demand and earnings built into the business model: Cellnex’s business model involves leasing space on their towers to mobile network operators (‘telcos’) to support antenna equipment. Access to power, fibre and the structural integrity of the tower is mission-critical to our community’s everyday mobile connectivity needs. Cellnex’s existing revenues are mostly long-term, contracted and predictable in nature. Existing ‘anchor’ tenants are generally locked into 15- to 20-year take-or-pay leases, with rents escalating annually at CPI or a fixed rate of 1-2%.
Monopoly-like characteristics support revenue growth over time: Cellnex has a lot of bargaining power with customers as it can be complex and capital-intensive to change tower providers without degrading network quality. Furthermore, Cellnex renegotiates anchor leases with customers on an ‘all-or-nothing’ basis, meaning telcos must decide between renewing all antennas or moving every single antenna to another tower. Given Cellnex has a significant proportion of the towers in each of its markets, moving to another tower provider would be exceptionally difficult. Cellnex can also benefit from other telcos wanting to improve their network coverage or densify their network, as they may lease space on existing towers to new tenants. This is highly profitable for Cellnex, as the cost of maintaining these simple structures does not increase significantly, meaning the majority of new revenue falls to the bottom line.
Strong competitive position to face market consolidation: We believe Cellnex has the scale and diversification to mitigate consolidation impacts. This gives the company an advantage over other players in the European market.
The company has undertaken key steps to refocus its business and rectify the balance sheet. The company has undergone a leadership transition, which now supports sustainable and growing shareholder remuneration, backed by a substantial step-up in free cash flow generation. Cellnex has already initiated a dividend policy for 2026 of €500 million plus a share buyback plan of up to €500 million. As Cellnex continues to de-lever and complete its inorganic capex obligations, we forecast these returns to grow sustainably over the medium term.
Compare this with some examples of companies that may look and feel like infrastructure, but on review of their economic models, do not appear to be high enough quality companies to meet our definition. Merchant power company Constellation Energy Corporation is one example. The MFG Core Infrastructure strategy does not hold Constellation, but it is among the largest positions in the S&P Index. Merchant power company Vistra, in which the strategy is also not invested, is another similar company, excluded from our definition and our portfolio following the same rationale.
Constellation operates as a generation/retail business, whereby it sells approximately 70% of its expected generation output to retail customers. For this segment, the company works to lock in a ‘retail margin’ on supply, including through long-term supply agreements and hedges. Constellation then aims to sell any remaining power to the wholesale market (or the company would need to buy surplus power required in the market, should there be a shortfall). This model leaves the company exposed to wholesale market prices, with approximately 30% of output sold in this market. Wholesale prices respond to supply and demand signals and exhibit significant volatility.
This in turn has historically driven significant risks to earnings quality, reflected in volatility in the company’s earnings and in its share price. In February 2021, extreme winter weather resulted in outages at some of Constellation’s generation plants in Texas. Given the harsh weather conditions, the period was characterised by very high demand and prices. To satisfy its customer supply obligations, Constellation was required to purchase power at the prevailing market price cap of around $9,000/MWh, resulting in losses of approximately US$800 million. This example highlights that the gentailer business model – which underpins merchant generation companies such as Constellation and Vistra – is inherently susceptible to hedging mismatches that risk significant periodic economic losses.
The volatility can also swing to the upside for these companies, particularly in periods of favourable competitive dynamics. For example, Constellation and Vistra recorded extraordinary stock price appreciation in 2024, as market expectations for AI, data centre expansion and rapid power demand growth accelerated. However, this then gave way to steep corrections in early 2025 on the announcement of DeepSeek AI, which represented a more efficient entrant to the AI market and shook market expectations for high power demand. The Constellation share price dropped 21% in a single session in January 2025. Elevated stock price volatility highlights the perceived leverage of merchant power companies to the AI theme and their high degree of exposure to technological, market and competitive forces.
Constellation Energy share price
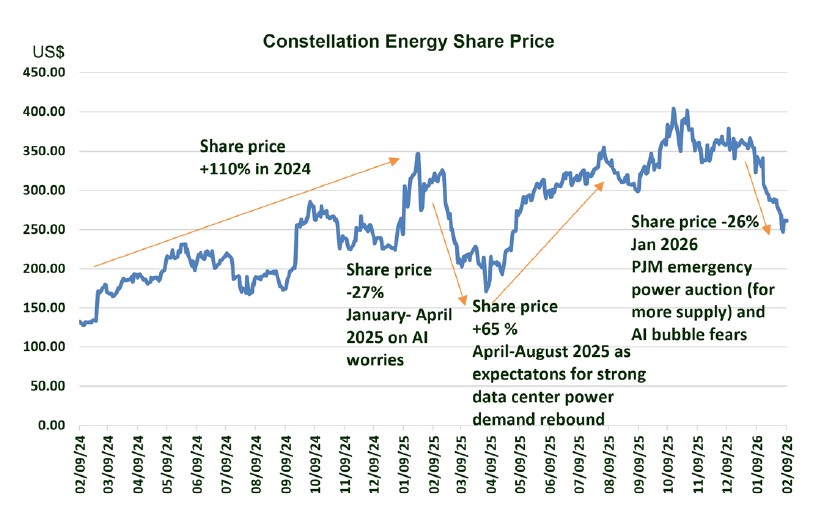
Source: FactSet, Magellan analysis. Data for the two years to 09 February 2026.
By virtue of our strict definition of infrastructure, we do not invest in those companies with undue exposure to competition. The example above demonstrates why merchant power generation companies sit outside our investible universe, given the inherent volatility of their earnings and the resulting erratic share price performance. We expect quality infrastructure companies to generate predictable cash flows supported by dependable demand. As such, we would not view an infrastructure strategy or allocation as the place to take on such volatility.
Commodity-exposed infrastructure companies, including many oil and gas pipelines, are another example of assets that are commonly bucketed as ‘infrastructure’ but, from our perspective, indicate significant risk to earnings quality and sit outside our universe. Targa Resources, along with other commodity-price-sensitive companies such as Williams and Cheniere Energy, is commonly included in infrastructure allocations. Historically, the share price has been highly correlated with the oil price, which reflects the underlying commodity price-sensitive nature of earnings. This drives a boom-bust pattern, as shown below. The 2015-2016 period is a case in point. From mid-2014, surging US shale oil production, resilient OPEC output and weakening global demand saw benchmark crude oil prices fall precipitously, weighing on the earnings of commodity-price-sensitive companies including Targa Resources. In 2016, supply disruptions affecting key oil exporters, OPEC+ production cuts, declining US shale production and improving global oil demand drove a sharp increase in benchmark oil prices. Prices more than doubled, creating a tailwind for earnings at Targa and other commodity-price-sensitive companies in the benchmark. This pattern was repeated in 2022-2023, as geopolitical tensions and recovering demand post COVID-19 fuelled stronger commodity prices, providing a tailwind for earnings and share price performance.
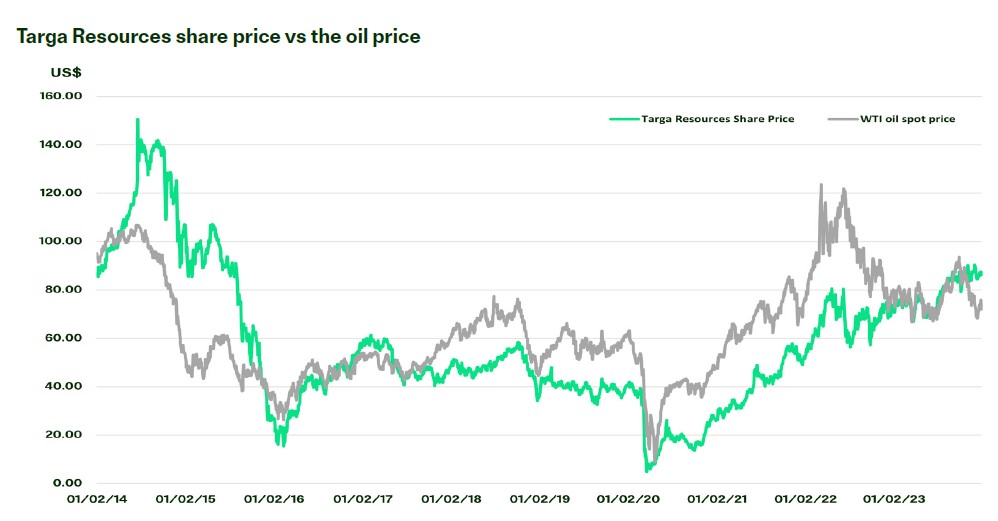
Source: FactSet, Magellan analysis.
However, these gains typically do not last as the boom-bust cycle that has typified this sector plays out. In our view, the volatile and pro-cyclical nature of these companies makes them inappropriate for an allocation within an infrastructure portfolio. Our quality focus actively screens out such pro-cyclical exposure, which is inconsistent with our guiding definition, looking for consistency in earnings over time.
These brief examples highlight that having a deep understanding of the economic models and businesses across the infrastructure universe provides for a disciplined approach to assessing quality and asset selection.
Definition and quality are instrumental to how infrastructure performs
Investing in quality listed infrastructure, supported by a disciplined definition, we believe aims to improve the reliability and durability of investor returns and enhance the diversification benefits achieved through an allocation to the asset class. The review of competition and commodity-price-exposed companies above is a reminder that not every opportunity that looks like infrastructure can deliver the defensive, stable characteristics investors are seeking.
As discussed above, high-quality infrastructure companies behave in a distinctive way, reflecting the strength of the businesses. This is evident in portfolio performance when comparing a tightly defined portfolio of quality companies with a broader infrastructure index. As shown in the annual returns table for the MFG Core Infrastructure strategy, the performance record is one of consistent, moderate-paced returns.
This contrasts with the more pronounced year-to-year upswings and downdrafts observed in portfolios that include lower-quality, less-defensive infrastructure companies outside our definition.
While there may be periods in which lower-quality companies outperform, over a full cycle we aim to achieve similar or better returns over time.
Annual returns for the MFG Core Infrastructure Strategy and key indices
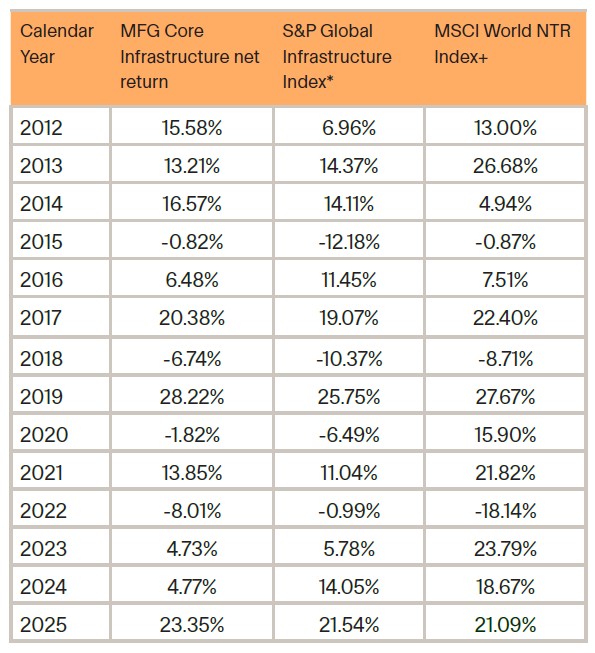
Source: Magellan, OECD, Data to 31 December 2025. Returns in USD. *S&P Global Infrastructure Index Net Total Return spliced with UBS Developed Infrastructure and Utilities Net Total Return Index prior to 1 January 2015. Note: as the UBS Developed Infrastructure and Utilities Net Total Return Index ceased to be published from 31 May 2015, it was replaced by Magellan on 1 January 2015 with the S&P Global Infrastructure Index Net Total Return.
The steadier return profile for well-defined, quality infrastructure is reinforced in looking at downside capture. In market drawdown for the MFG Core Infrastructure strategy and key indices chart, we can see that infrastructure draws down significantly less than broader equities. This exemplifies the diversification characteristics that attract many investors to the asset class. Importantly, the MFG Core Infrastructure strategy, as a specialist strategy focused on high-quality companies, has experienced significantly less drawdown than broader infrastructure indices.
As a result, we can see that a portfolio focused on quality companies behaves differently from the broader infrastructure universe. Over the period observed, it has delivered more dependable returns and demonstrated lower cyclicality relative to the broader benchmark.
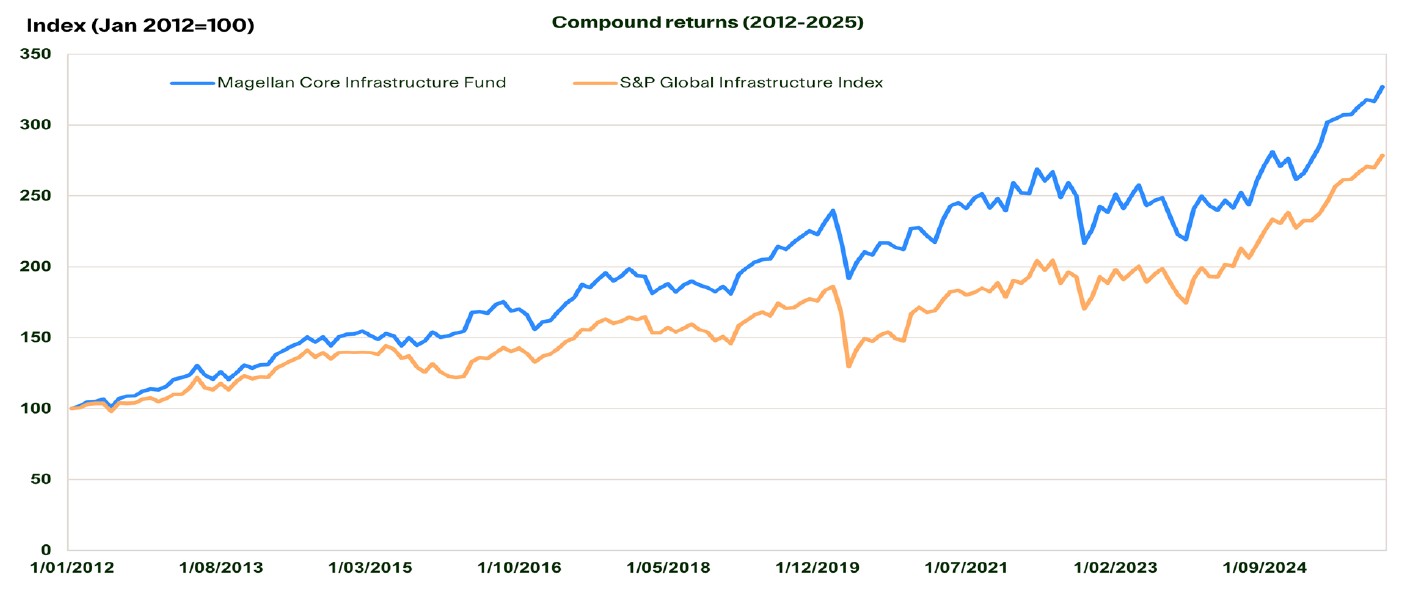
This matters because steady returns may turn into greater accumulation of capital over the long term by virtue of compounding. A portfolio that declines less in weaker markets is better positioned to resume building gains when conditions improve. The chart below makes this clear, with the slow and steady approach of investing in high-quality companies ultimately outperforming more volatile investments with higher compound returns over time.
Drawdown for the MFG Core Infrastructure Strategy and key indices
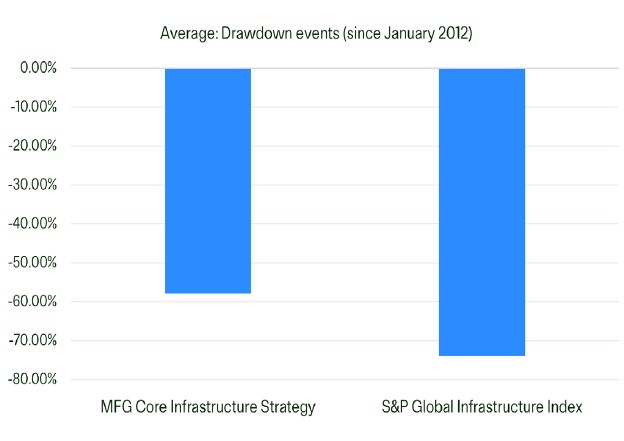
Source Magellan, Bloomberg. Equity market drawdowns are defined as events where the MSCI World NTR Index has declined by 5% or more. The numerical information above is based on the net returns of a representative portfolio which has the highest fee charged to any client in this composite. The representative portfolio is an account in the Global Core Infrastructure Composite that closely reflects the portfolio management style of the strategy. Performance is not a consideration in the selection of the representative portfolio. The characteristics of the representative portfolio may differ from those of the composite and of the other accounts in the composite.
The MFG Core Infrastructure Strategy aims to generate robust compound returns over time
A specialist approach supports solid long-term returns
For investors seeking more stable long-term return characteristics, a quality-driven investment philosophy and process we believe aims to identify companies with resilient business models and sustainable earnings. A specialist approach – underpinned by a disciplined definition of quality – focuses on listed infrastructure companies that we believe are better positioned to deliver dependable growth over time.
Historically, portfolios constructed in this way have exhibited differentiated performance characteristics, including lower cyclicality and improved diversification relative to broader infrastructure benchmarks. This approach focuses on generating real returns over time through investment in high-quality infrastructure companies, characterised by consistent demand, disciplined operations and resilient earnings.
Over the long term, such assets have historically delivered mid-single-digit earnings growth, with returns broadly in line with OECD G7 CPI+5%^, although outcomes will vary depending on market conditions. In our view, this approach reflects the distinct and complementary role that quality listed infrastructure can play within a diversified portfolio.
By Magellan Global Listed Infrastructure Investment Team
+All MSCI data used is the property of MSCI. No use or distribution without written consent. Data provided “as is” without any warranties. MSCI and its affiliates assume no liability for or in connection with the data. Please see complete disclaimer in https://magellaninvestmentpartners.com/funds/benchmark-information.
^ OECD G7 data only available to September 30 2025. The September CPI value has been applied as a proxy to calculate numbers for the December 2025 quarter.
Important Information: This material is not intended to constitute advertising or advice of any kind and you should not construe the contents of this material as legal, tax, investment or other advice. In making an investment decision, you should read and consider any relevant offer documentation applicable to any investment product or service and must rely on your own examination of the same and consider obtaining professional investment advice tailored to your specific circumstances before making any investment decision. The investment program of the strategy or strategies presented herein (‘Strategy’) is speculative and may involve a high degree of risk. The Strategy is not intended as a complete investment program and is suitable only for sophisticated investors who can bear the risk of loss. The Strategy may lack diversification, which can increase the risk of loss to investors. The Strategy’s performance may be volatile. Past performance is not necessarily indicative of future results and no person guarantees the future performance of the Strategy, the amount or timing of any return from it, that asset allocations will be met, that it will be able to implement its investment strategy or that its investment objectives will be achieved. Statements contained in this material that are not historical facts are based on current expectations, estimates, projections, opinions and beliefs and such statements involve known and unknown risks, uncertainties and other factors, and undue reliance should not be placed thereon. This material may contain ‘forward-looking statements’. Actual events or results or the actual performance of the Strategy or any financial product or service may differ materially from those reflected or contemplated in such forward-looking statements. The Strategy will have limited liquidity, no secondary market for interests in the Strategy is expected to develop and there are restrictions on an investor’s ability to withdraw and transfer interests in the Strategy. The management fees, incentive fees and allocation and other expenses of the Strategy will reduce trading profits, if any, or increase losses.
No representation or warranty is made with respect to the correctness, accuracy, reasonableness or completeness of any of the information contained in this material. This information is subject to change at any time and no person has any responsibility to update any of the information provided in this material. This material may include data, research and other information from third party sources. No guarantee is made that such information is accurate, complete or timely and no warranty is given regarding results obtained from its use. The issuer of this material and its related entities and affiliates will not be responsible or liable for any losses, whether direct, indirect or consequential, including loss of profits, damages, costs, claims or expenses, relating to or arising from your use or reliance upon any part of the information contained in this material including trading losses, loss of opportunity or incidental or punitive damages.
This material and the information contained within it may not be reproduced, or disclosed, in whole or in part in any circumstances. , Further information regarding any benchmark referred to herein can be found at www.magellaninvestmentpartners.com/funds/benchmark-information/. Any third-party trademarks contained herein are the property of their respective owners and are used for information purposes and only to identify the company names or brands of their respective owners. (121125-#i1)
United Kingdom: This material has been prepared by Magellan Asset Management Limited (ABN 31 120 593 946 AFSL 304 301) doing business as Magellan Investment Partners and is distributed in the United Kingdom by Magellan Investment Partners (UK) Limited (FRN: 1037936), an appointed representative of Sentinel Regulatory Services Ltd (FRN: 1007093) which is authorised and regulated by the Financial Conduct Authority. This material does not constitute an offer or inducement to engage in an investment activity under the provisions of the Financial Services and Markets Act 2000 (FSMA). This material does not form part of any offer or invitation to purchase, sell or subscribe for, or any solicitation of any such offer to purchase, sell or subscribe for, any shares, units or other type of investment product or service. This material or any part of it, or the fact of its distribution, is for background purposes only. This material has not been approved by a person authorised under the FSMA and its distribution in the United Kingdom and is only being made to persons in circumstances that will not constitute a financial promotion for the purposes of section 21 of the FSMA as a result of an exemption contained in the Financial Services and Markets Act 2000 (Financial Promotion) Order 2005 (FPO) as set out below. This material is exempt from the restrictions in the FSMA as it is to be strictly communicated only to ‘investment professionals’ as defined in Article 19(5) of the FPO.
United States: This material has been prepared by Magellan Asset Management Limited (ABN 31 120 593 946 AFSL 304 301) doing business as Magellan Investment Partners (‘Magellan’) which is a registered investment adviser. The investment strategies described herein are distributed in the United States by Magellan Investment Partners North America, Inc., a U.S.-registered investment adviser. For the purposes of the US Securities Act 1933, Magellan and Magellan Investment Partners North America, Inc. are affiliated entities. Registration as an investment adviser does not imply any level of skill or training.
This material is not intended as an offer or solicitation for the purchase or sale of any securities, financial instrument or product or to provide financial services. It is not the intention of Magellan to create legal relations on the basis of information provided herein. Past performance does not guarantee future results. Where performance figures are shown net of fees charged to clients, the performance has been reduced by the amount of the highest fee charged to any client employing that particular strategy during the period under consideration. Actual fees may vary depending on, among other things, the applicable fee schedule and portfolio size. Fees are available upon request and also may be found in Part II of Magellan’s Form ADV.
Canada: This material is provided to you by Magellan Asset Management Limited (ABN 31 120 593 946 AFSL 304 301) doing business as Magellan Investment Partners (‘Magellan’). Magellan is not registered in any province in Canada. The head office of Magellan is in Sydney, Australia and all or substantially all of its assets are situated outside of Canada. Due to the foregoing, there may be difficulty enforcing legal rights against Magellan.
South Africa: This material is provided to you by Magellan Asset Management Limited (ABN 31 120 593 946 AFSL 304 301) doing business as Magellan Investment Partners, who in accordance with FAIS Notice 55 of 2023 issued by the Financial Sector Conduct Authority, Magellan Investment Partners is exempted from section 7(1) of the Financial Advisory and Intermediary Services Act, 2002 (Act No. 37 of 2002). This material is not an offer in terms of Chapter 4 of the Companies Act, 2008.
UAE: This material has been produced by Magellan Asset Management Limited (ABN 31 120 593 946 AFSL 304 301) doing business as Magellan Investment Partners. This material is not for distribution to any other person. This material, and the information contained herein, does not constitute, and is not intended to constitute, a public offer of securities in the United Arab Emirates (‘UAE’) and accordingly should not be construed as such. Any offer of securities or financial services is made only to a limited number of exempt Professional Investors in the UAE who fall under one of the following categories: federal or local governments, government institutions and agencies, or companies wholly owned by any of them. No securities or services have been approved by or licensed or registered with the UAE Central Bank, the Securities and Commodities Authority, the Dubai Financial Services Authority, the Financial Services Regulatory Authority or any other relevant licensing authorities or governmental agencies in the UAE (the ‘Authorities’). The Authorities assume no liability for any investment that the named addressee makes as a Professional Investor. This material is for the use of the named addressee only and should not be given or shown to any other person (other than employees, agents or consultants in connection with the addressee’s consideration thereof).
Japan: This material is prepared by Magellan Asset Management Limited (ABN 31 120 593 946 AFSL 304 301) doing business as Magellan Investment Partners. The content is for informational purposes only and directed at Qualified Institutional Investors and other professional investors as defined in the Financial Instruments and Exchange Act. No distribution of this material will be made in any jurisdiction where such distribution is not authorised or is unlawful. This material does not constitute, and may not be used for the purpose of, an offer or solicitation in any jurisdiction or in any circumstances in which such an offer or solicitation is unlawful or not authorized or in which the person making such offer or solicitation is not qualified to do so.
Other jurisdictions: This material is provided to you by Magellan Asset Management Limited (ABN 31 120 593 946 AFSL 304 301) doing business as Magellan Investment Partners. No distribution of this material will be made in any jurisdiction where such distribution is not authorised or is unlawful. This material does not constitute, and may not be used for the purpose of, an offer or solicitation in any jurisdiction or in any circumstances in which such an offer or solicitation is unlawful or not authorized or in which the person making such offer or solicitation is not qualified to do so.