The liquid complement

For investors looking for dependable real growth, infrastructure is an important component of any portfolio. Owning assets whose cash flows are underwritten by regulation, long-term contracts and indispensable demand produces predictable, inflation-linked earnings that have historically stood up through recessions and shocks and provided the foundations for real growth over time. We view this as infrastructure’s core purpose in investor portfolios – to enhance risk-adjusted returns by providing diversification and preserving capital in challenging market conditions while delivering real growth over time. Furthermore, investing in infrastructure through listed vehicles provides a nimble and liquid means to access this asset class.
When investors consider infrastructure, this is often synonymous with private, or unlisted, investments in infrastructure assets. Indeed, market data suggest that private infrastructure has become one of the fastest-growing asset classes among institutional investors, with assets under management rising by more than 15% per year.1 Dry powder, or undeployed capital, or infrastructure strategies was estimated at US$333.9 billion at the start of 2025 , which is more than double that of US$150.1 billion in early 2015.
In our view, investing in listed or unlisted infrastructure is not a “one or the other” investment decision. Listed and unlisted infrastructure assets exhibit different characteristics that enhance the expected risk-adjusted return of a portfolio. These differences are apparent across quality, diversification, volatility and liquidity of listed and unlisted assets. At the same time, historical returns for listed infrastructure have been at least comparable to those for unlisted infrastructure assets, suggesting that investors don’t give up any return to achieve these differentiated characteristics.
To make these complementary roles clear, in the following sections, we look at the three inherent benefits investors see in unlisted infrastructure and examine these from the perspective of global listed infrastructure:
• Predictable cash flows
• Diversification
• Mitigation of volatility
We also look at liquidity. Liquidity is a fundamental difference between listed and unlisted approaches and supports their complementary properties in a portfolio.
Predictable cash flows
Investment allocations to infrastructure through unlisted infrastructure funds or private market transactions are aimed at securing steady, inflation-linked returns over the long term. Fuelling this demand is the expectation that some high-quality infrastructure projects can best be accessed via private markets (for example, airports or unlisted water or electricity utilities), which will then provide superior, predictable returns.
However, access to resilient returns is equally achievable through investment in listed infrastructure. This is because the sector and business model fundamentals that underpin the earnings profile for unlisted companies also hold true for listed assets. For example, a regulated utility, either listed or unlisted, is governed by an economic regulatory framework that provides for an agreed rate of return, allowable capital expenditure and limited competition. These drivers are instrumental in achieving stable, long-term, inflation-linked returns.
Listed infrastructure offers a unique proposition compared to unlisted investments, as it provides access to a large, transparent opportunity set. Listed infrastructure companies hold many high-quality assets that are not available in unlisted markets. For example, global toll road operators Transurban and Ferrovial, Spain’s airport system operator Aena and Italy’s largest gas company Italgas are listed infrastructure companies. Investors in these companies have been well-rewarded, as they have achieved rising returns on equity and higher earnings per share over time. As a case in point, Figure 1 below shows traffic, revenue and earnings growth for Ferrovial’s 407 ETR toll road, located in Ontario, Canada. This shows sustained, reliable growth in demand, supporting ongoing robust growth in revenue and earnings. Furthermore, US regulated utilities such as WEC Energy are an example of a sub-sector where listed markets are the predominant way to invest. These utilities offer predictable cash flows and reliable earnings growth2, reflecting regulated returns, and are largely available only as listed assets.
Figure 1: Listed infrastructure assets provide predictable earnings growth, backed by dependable demand
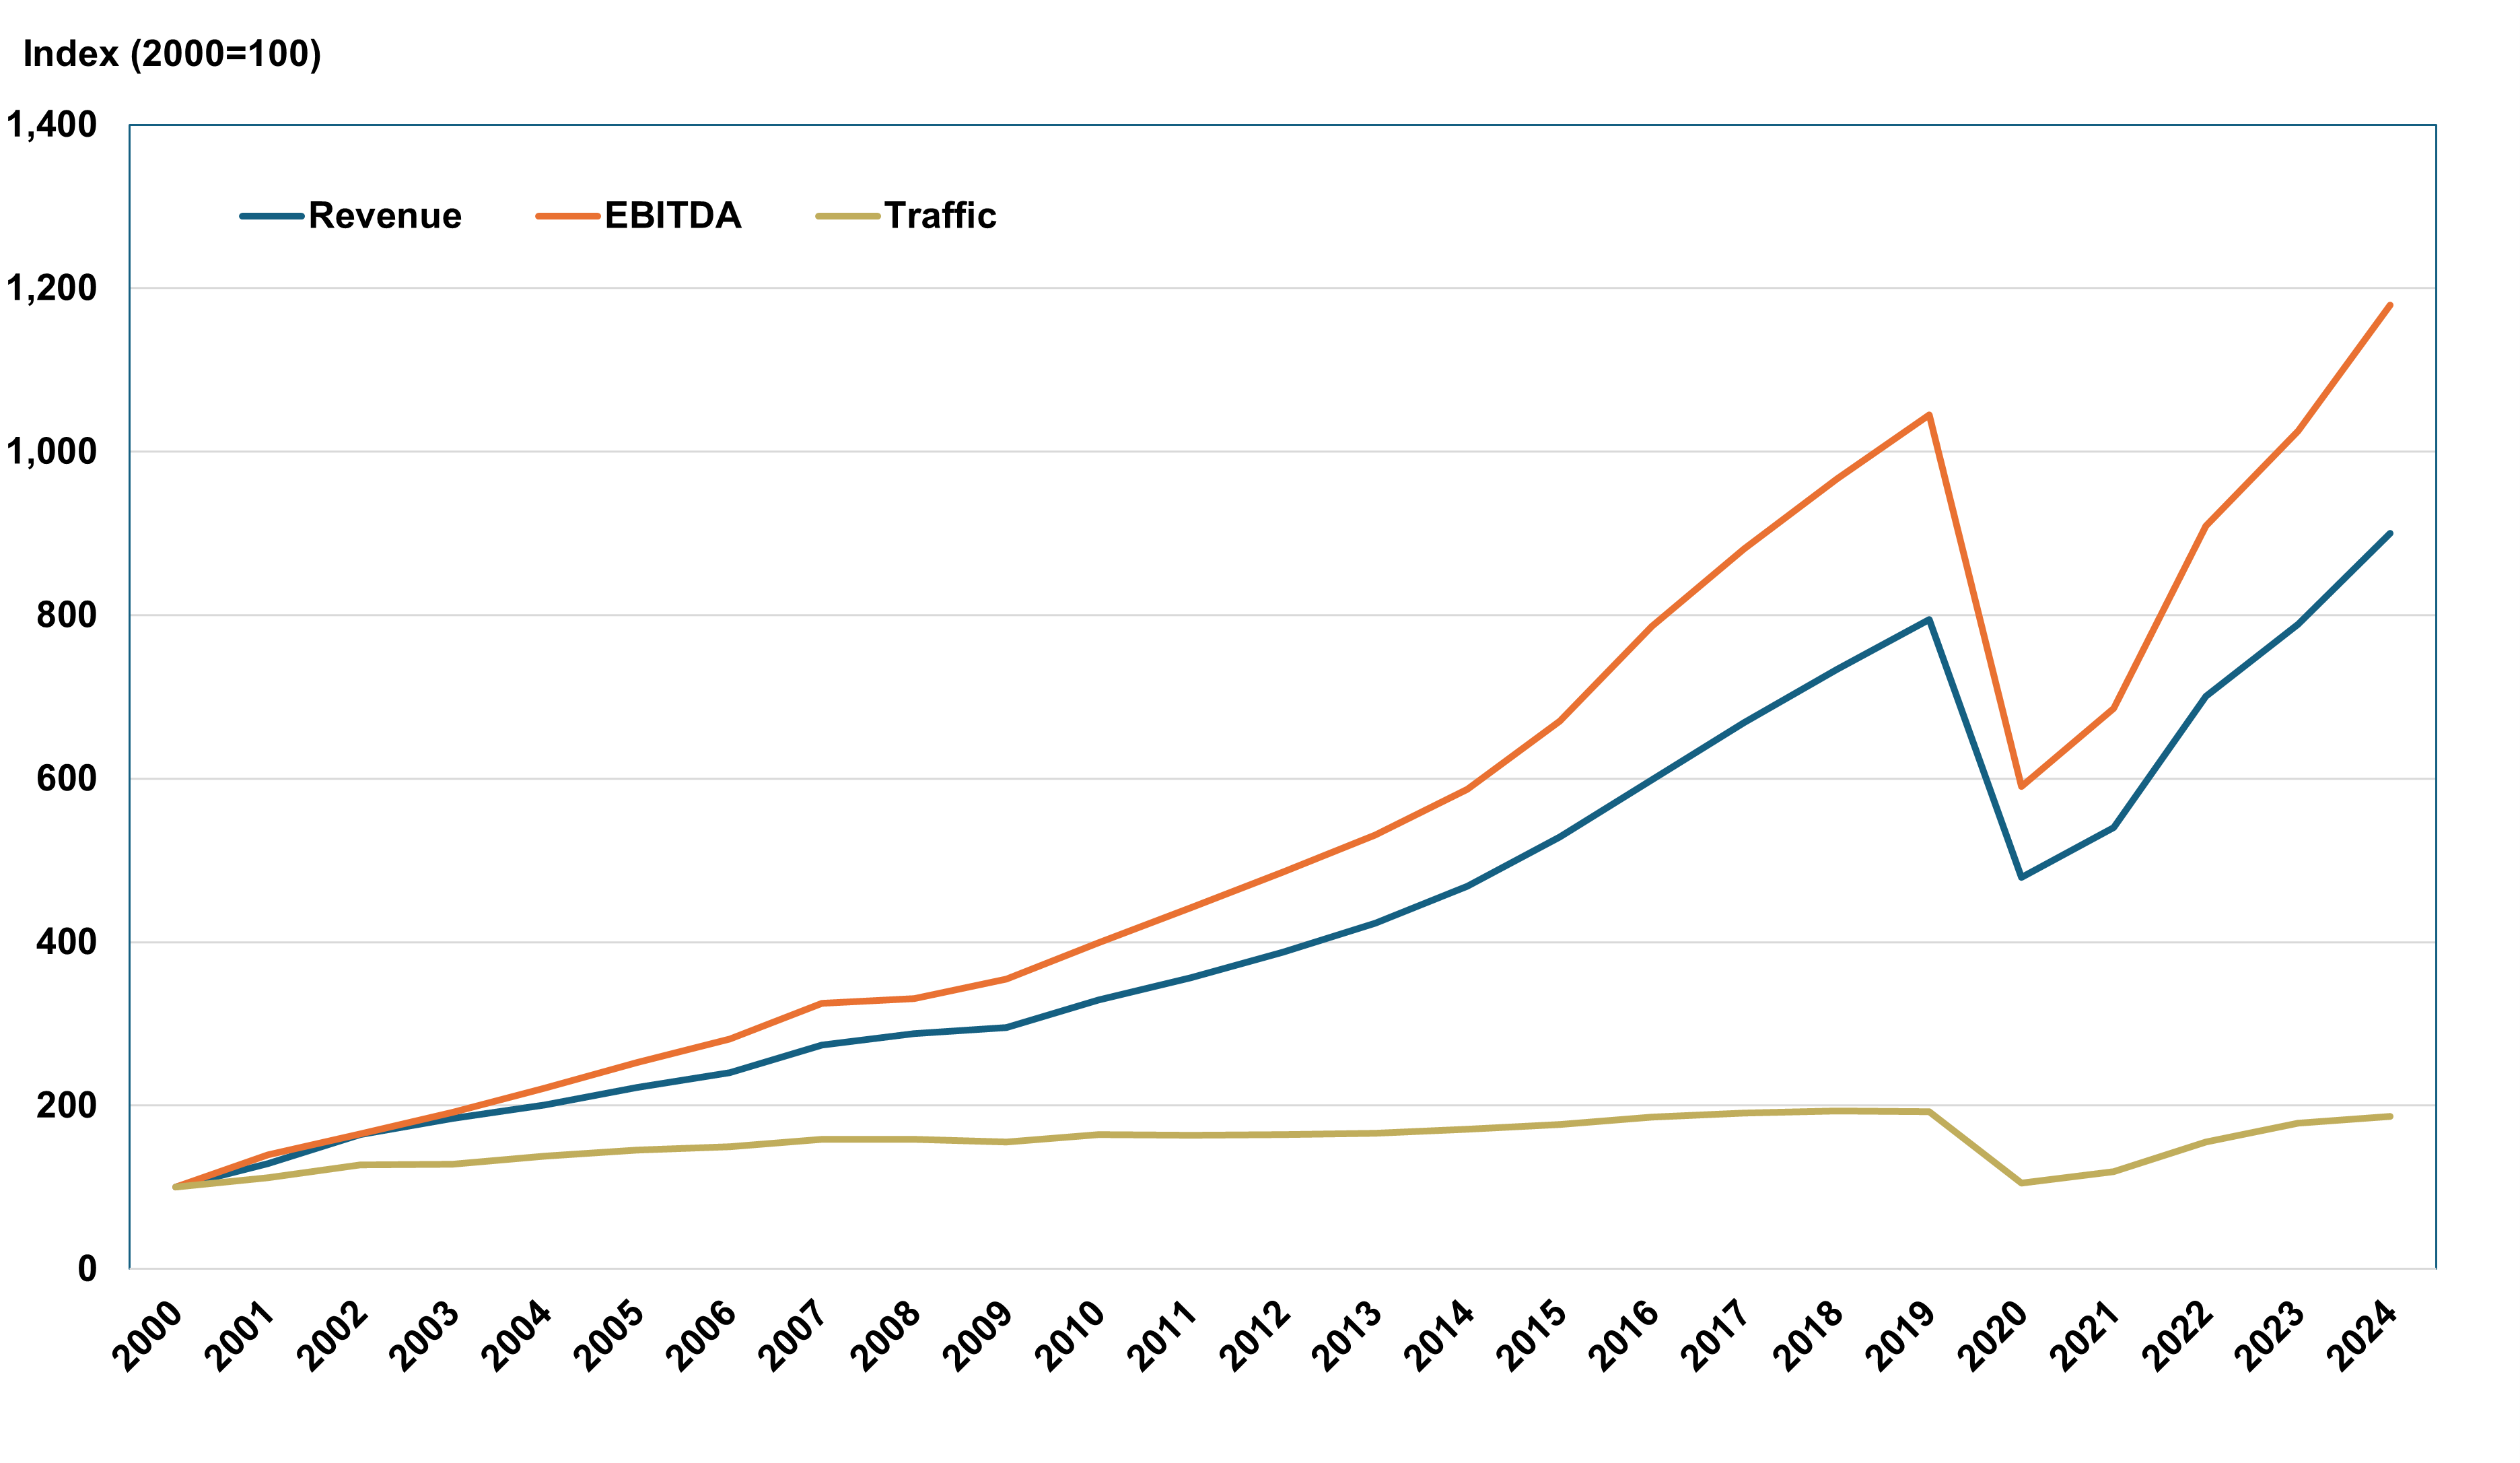
Source: Ferrovial, Magellan analysis of company disclosures.
Listed infrastructure companies are also distinct in the scale of their portfolios. This breadth provides for diversification in earnings and the opportunity to achieve greater operational efficiencies, which support reliable earnings growth. Communications infrastructure is one such example, with listed company American Tower owning nearly 150,000 communications sites, including 42,000 tower sites in the US. Network infrastructure such as US freight rail is another example where a listed company like CSX has a large-scale portfolio that is difficult to replicate through private market investment in rail assets.
The data also suggest that on a relative basis, listed infrastructure is at least as good as its unlisted peers on financial performance. For example, a proxy can be seen in Figure 2, which shows that for a sample of European airports, listed airports typically performed in the top half of the group for total revenue per passenger.
Figure 2: Financial performance for European airports shows listed companies perform at least as well as their unlisted peers
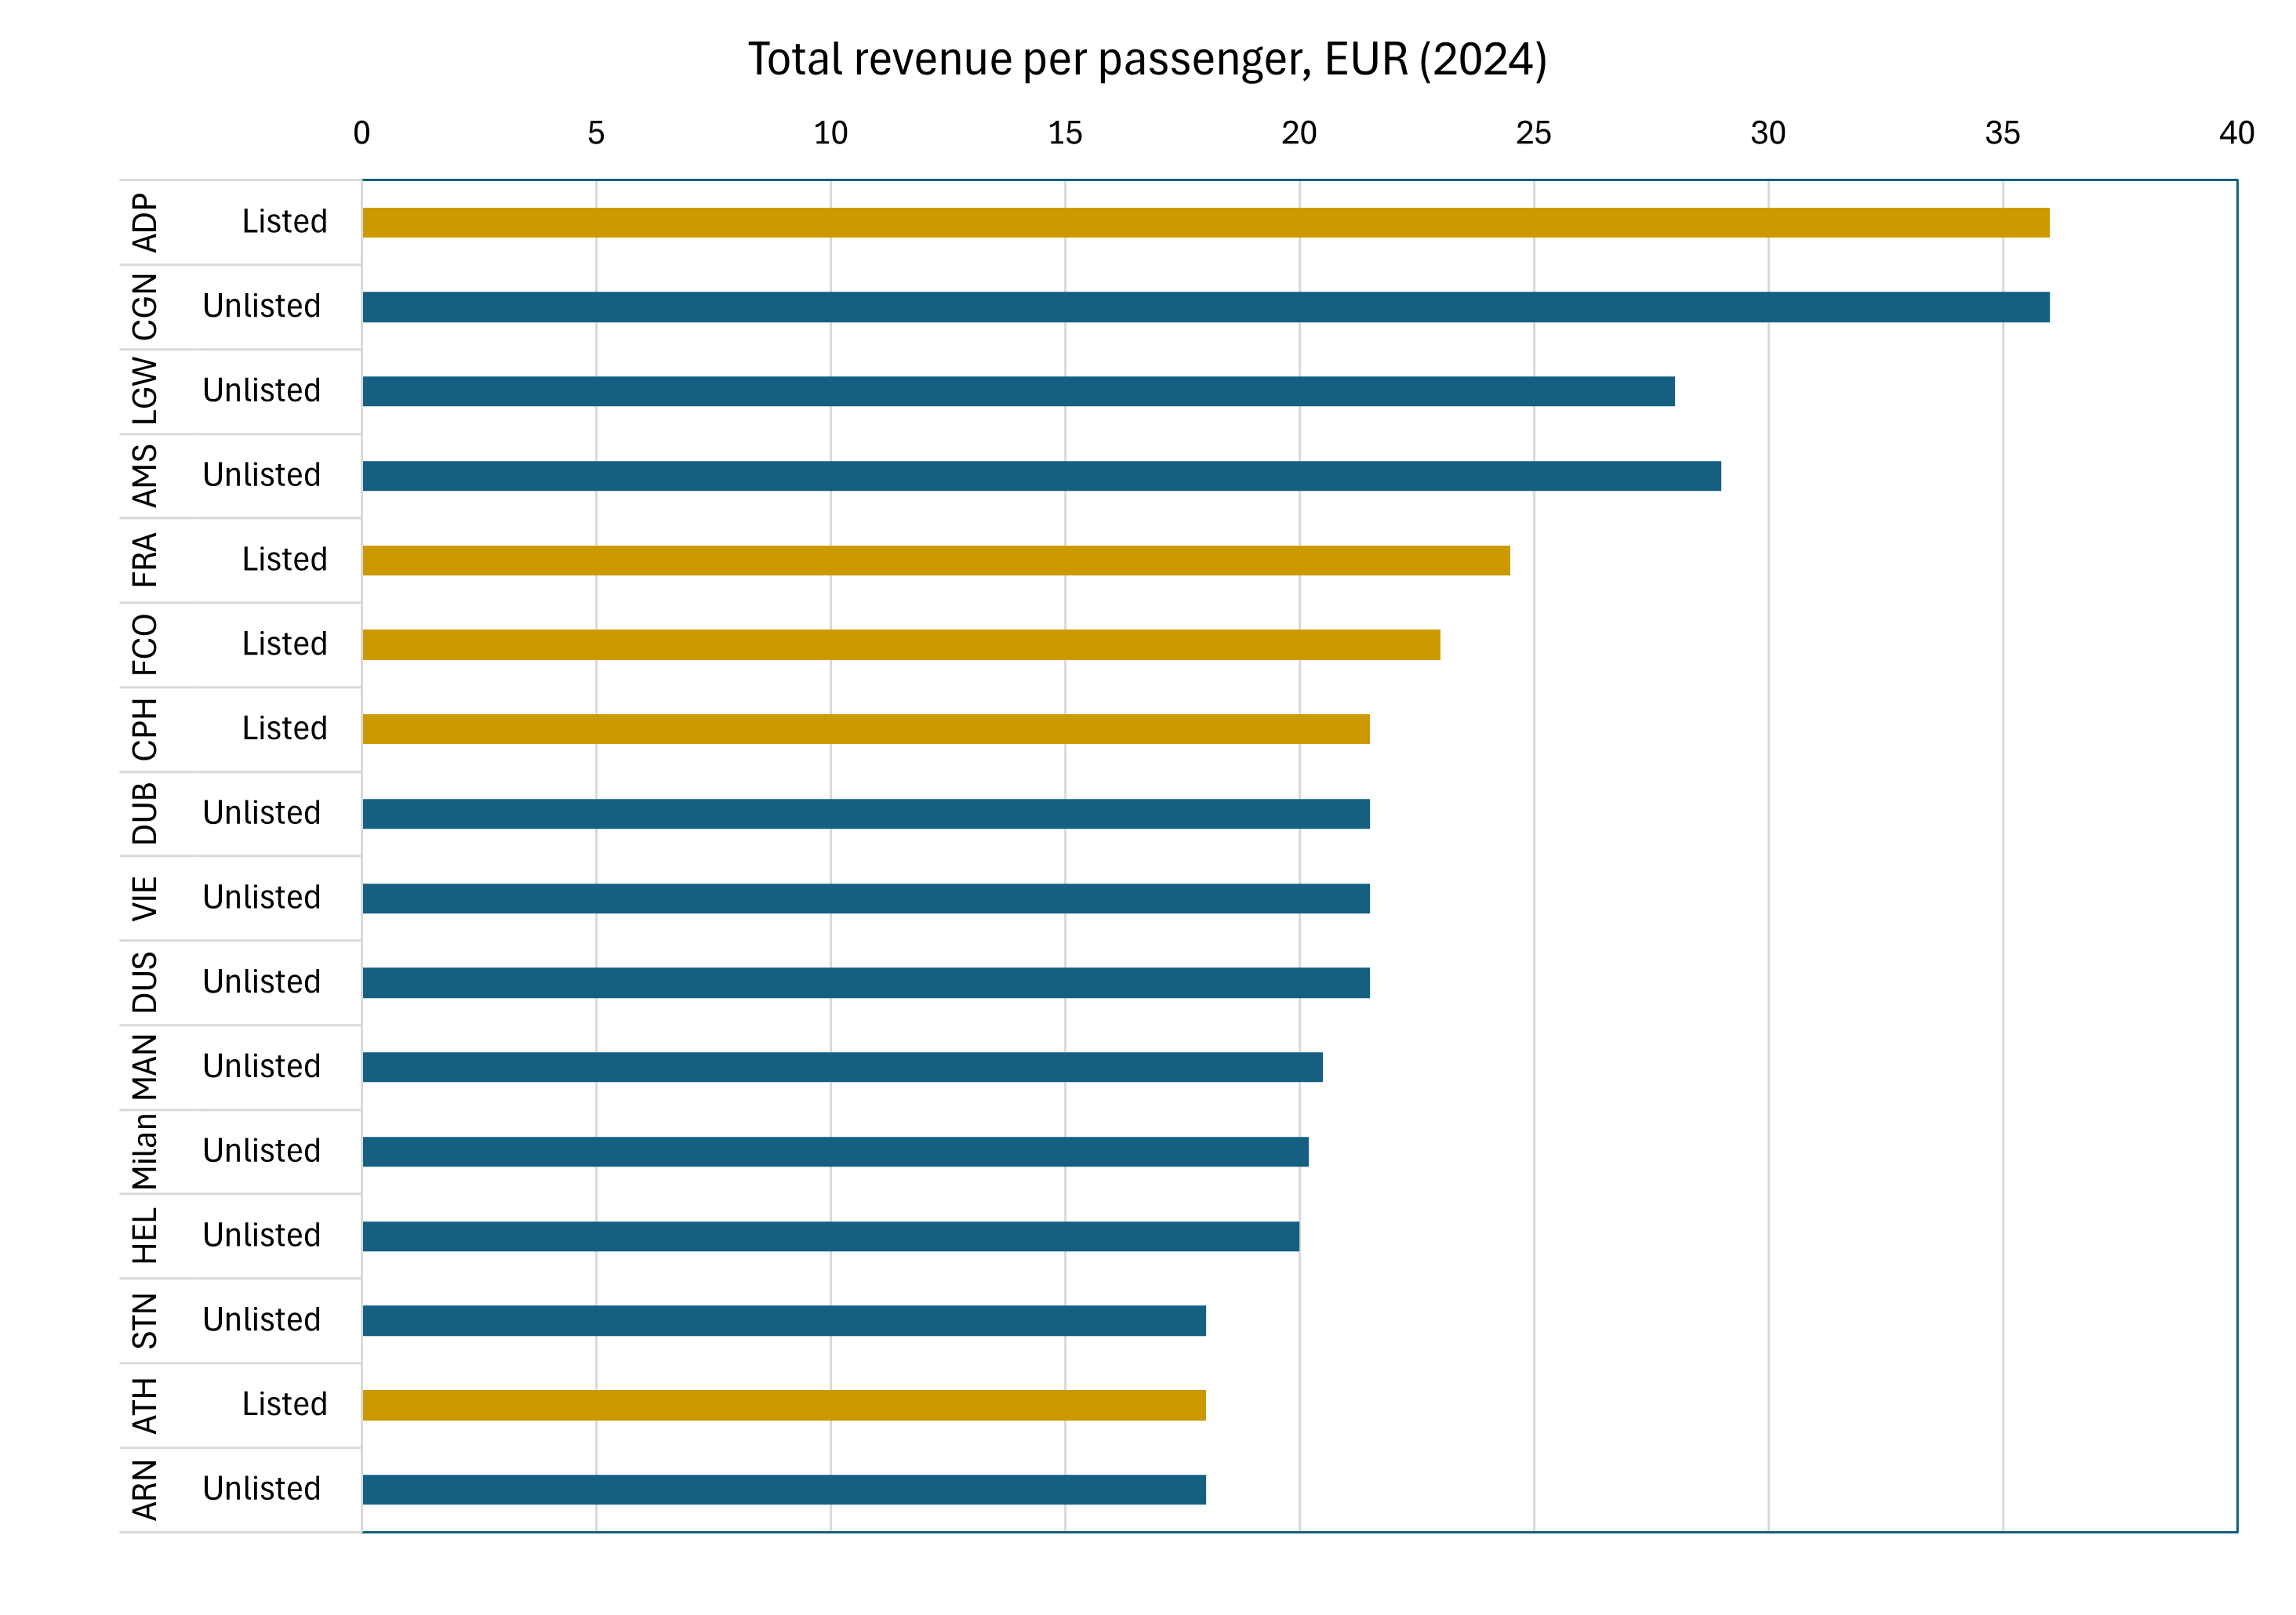
Source: Magellan analysis, Irish Aviation Authority
Diversification
The appeal of unlisted infrastructure also reflects the expectation that unlisted assets provide greater diversification to an investor’s portfolio.
Unlisted infrastructure is seen to offer lower correlation with listed markets and other asset classes. As a result, a portfolio with this unlisted exposure is seen to provide an improved risk/return profile, supporting net returns that are more stable when these assets are included. We can observe that unlisted infrastructure has notably smooth returns, which promotes lower measured correlation to listed infrastructure and the equity market. This is shown in annual returns over the last ten years (in Figure 3 below).
Importantly, this is very much an artefact of the valuation methodology for unlisted assets, rather than a fundamental difference in the assets themselves3. The chart highlights a key characteristic of unlisted funds, which is the infrequent, appraisal-based valuation methodology used for returns. These are often computed with a sizeable lag of several months, which smooths out valuation and has a significant impact on returns and correlations. The 2022-2025 period is an important example, as while listed infrastructure recorded a string of negative returns, which reflected real-time market pricing in response to rate hikes, unlisted infrastructure continued to post positive returns. Only in late 2024/early 2025 have private market returns turned down while listed returns have risen. Figure 3 below illustrates this lag.
Figure 3 Yearly returns for private market infrastructure are noticeably smoothed
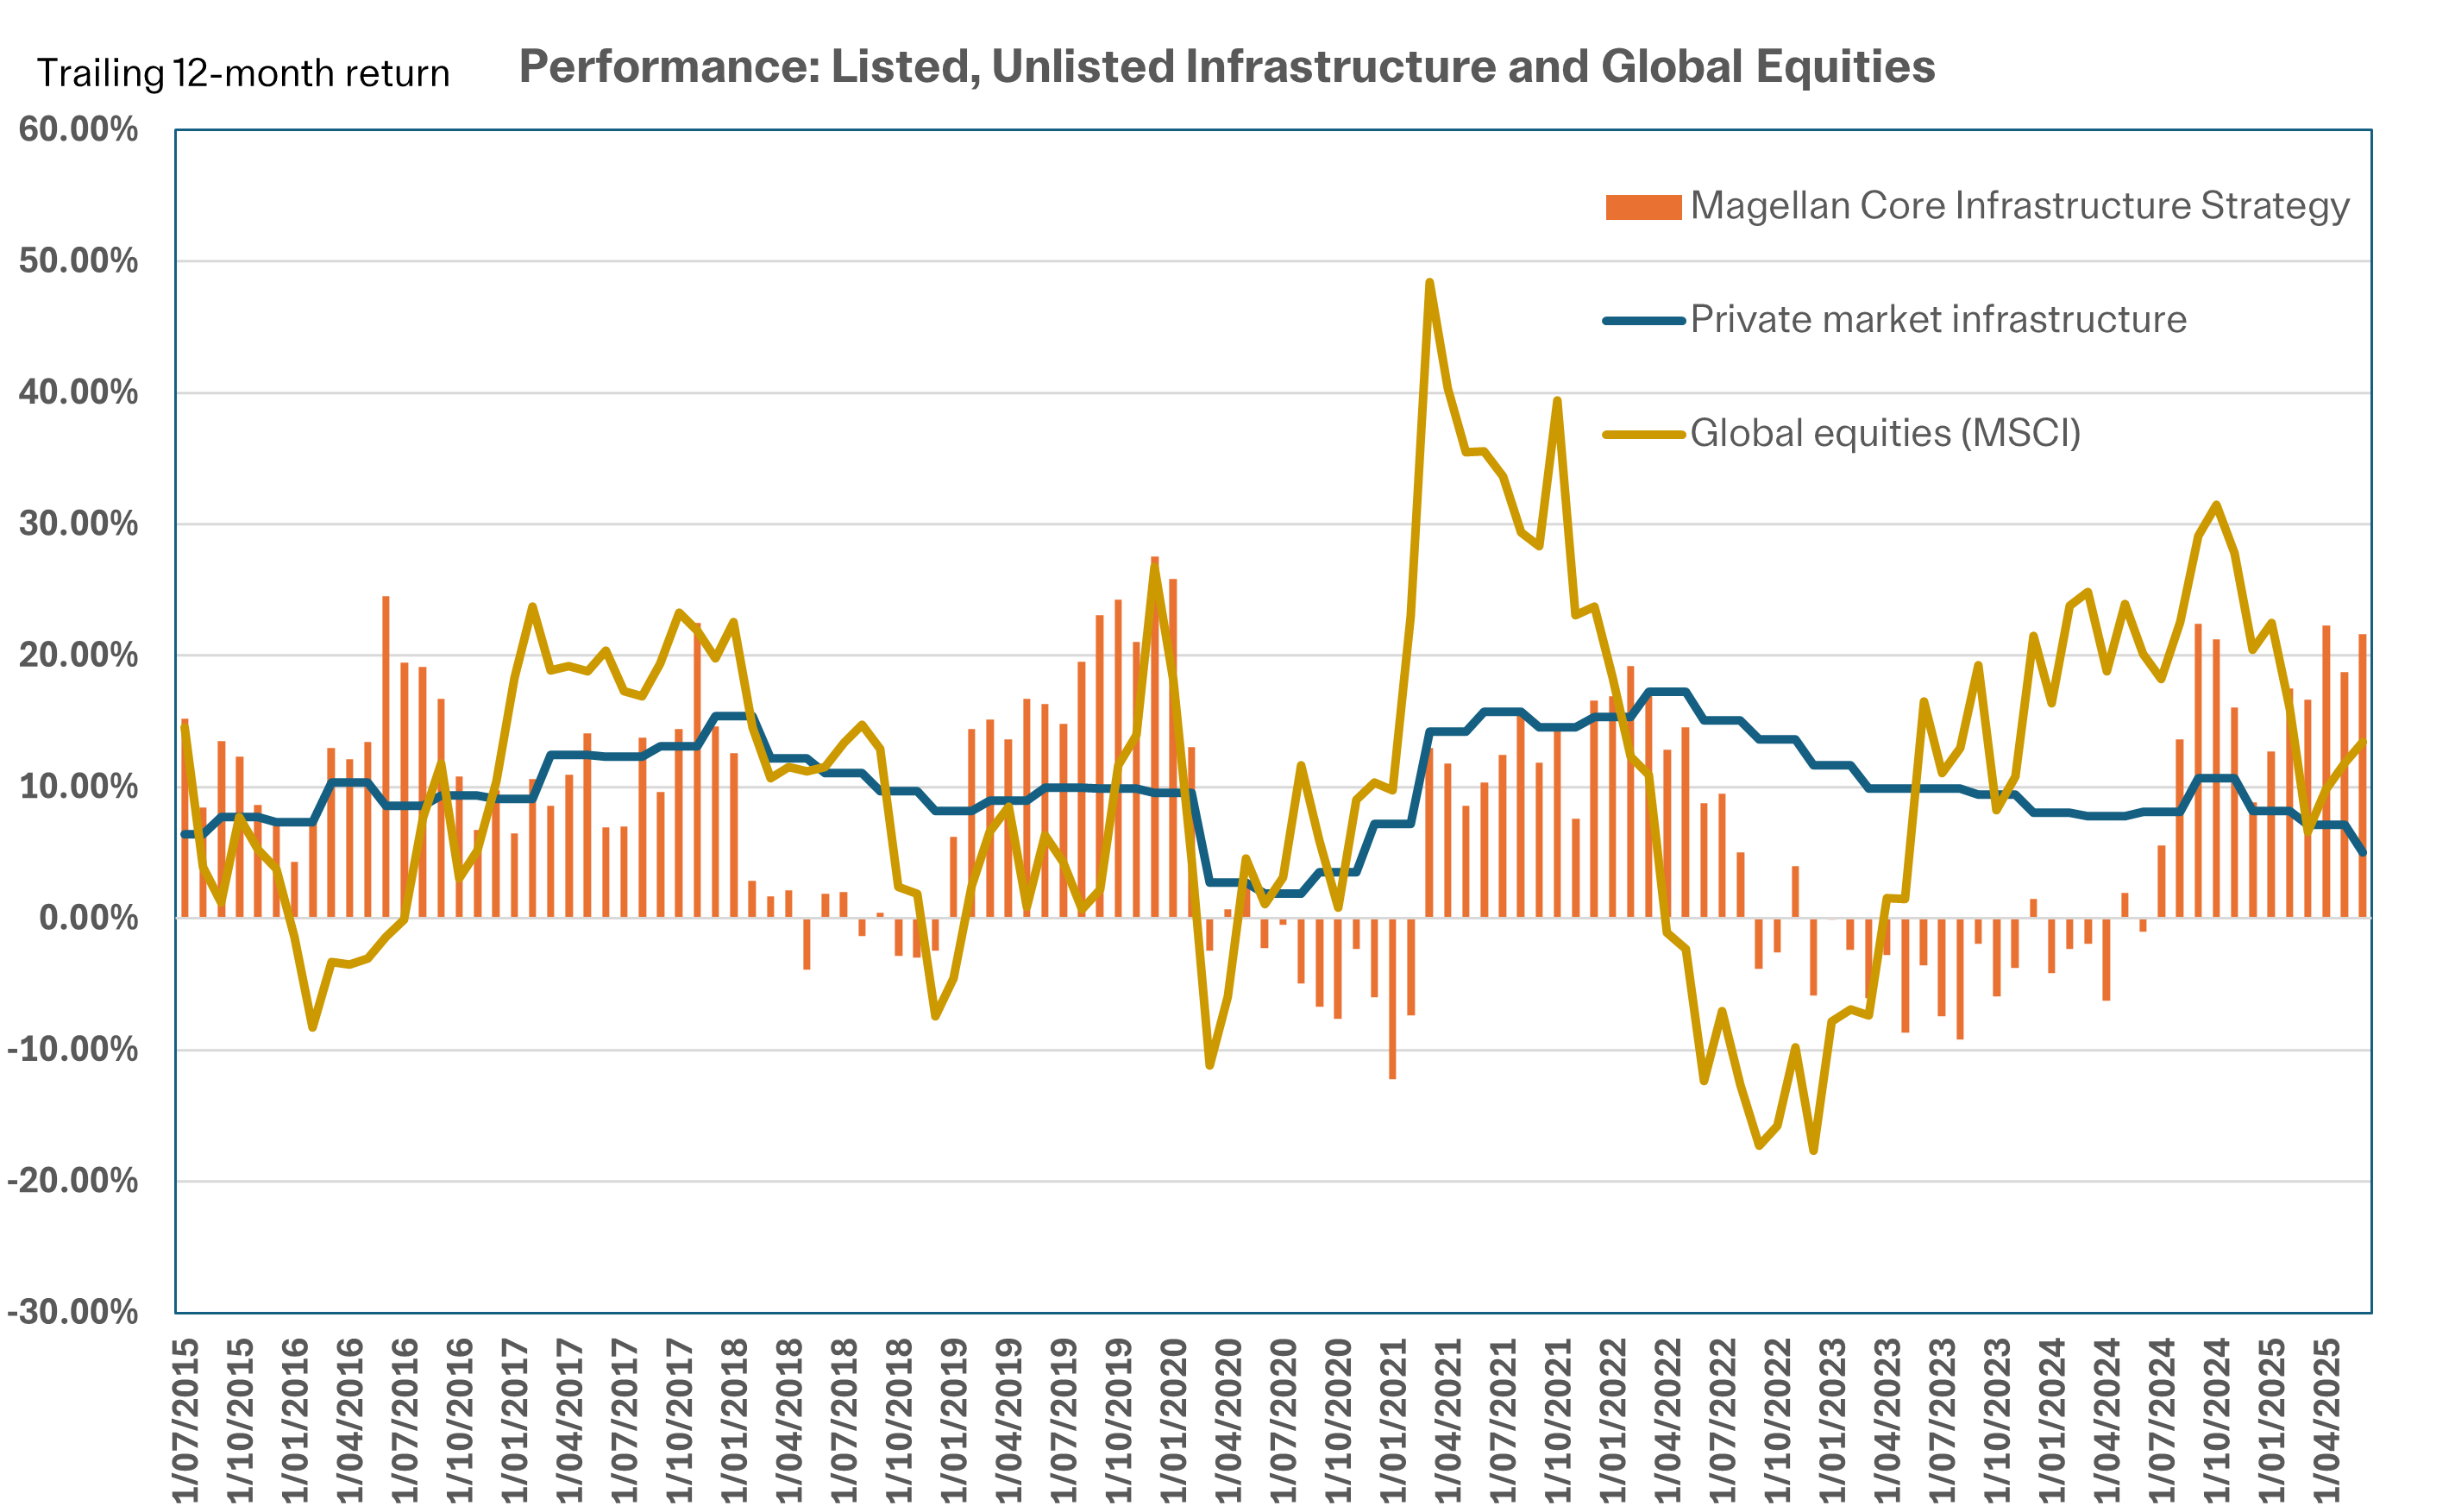
Source: GLIO, Bloomberg, Magellan, Magellan analysis. MFG Core Infrastructure data is net of fees and hedged in AUD. Calculations are based on exit price with distributions reinvested, after ongoing fees and expenses but excluding individual tax, member fees and entry fees (if applicable).Global equities refers to the MSCI World TR index, net of fees and hedged in AUD. Private markets infrastructure refers to the midpoint series aggregate per GLIO.
For investors considering the complementary roles of listed and unlisted infrastructure in a portfolio, it is important to be aware of the implications of this smoothing approach undertaken for unlisted infrastructure assets. While unlisted asset portfolios can smooth out returns in choppy market periods, this deferred approach presents a valuation risk at a later time, when the portfolio looks to exit. As an example, we observe that the more stable reported returns for unlisted assets over 2022 to 2023 could reflect valuers ‘looking through’ the elevated interest rates of that time to a lower, more normal long-term discount rate. Crucially, that subsequent unlisted returns have deteriorated from late 2024/early 2025 might suggest that the persistence of higher rates has now prompted valuers to incorporate higher rates in their models. This use of higher rates presents a risk, as the use of lower rates in 2022-2023 would mean valuations in this period were overstated. For unlisted strategies looking to exit these assets in the future, these higher rates could be expected to weigh on their achieved returns at exit, which is the ultimate measure of returns.
Country and sector diversification are other key elements to overall diversification in a portfolio. On this point, listed infrastructure typically offers more diverse allocation of capital. Through investment in listed infrastructure, investors have access to a more diverse range of geographies and markets than they would in a typical unlisted infrastructure fund. For example, access to global infrastructure companies like Ferrovial (NL) and Vinci (FR), toll roads including Transurban (AU), and high-quality water utilities including Severn Trent (UK) are possible in the listed market. This broader opportunity set enables investors to gain access to high-quality projects with exposures to multiple economies, supporting the build-up of a well-diversified infrastructure portfolio. Figure 4 below shows the diverse geographic and sector split of the MFG Core Infrastructure Strategy as an example.
Figure 4: The MFG Core Infrastructure Strategy has diverse geographic and sector exposures
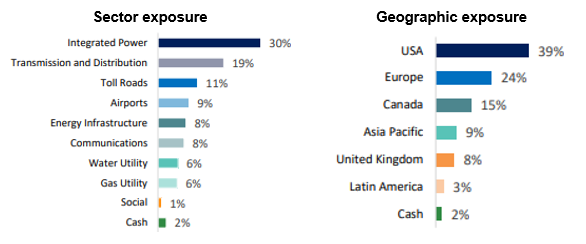
As at 30 September 2025
This diversification is a notably different picture from unlisted funds that hold a more concentrated portfolio and are therefore more exposed to unintended risks or consequences. Unlisted funds typically hold a concentrated portfolio of between 5 and 15 assets, which are selected based on what is available at a point in time. Given this narrower scope, there can also be a tilt to a particular sector or region. For example, Preqin data shows that from 2015 to 2018, approximately 50% of completed infrastructure deals were focused on renewable energy generation assets. This dynamic has persisted, with an estimated 25% of developed market private market infrastructure deals between 2022 and 2025 YTD in renewable energy infrastructure4. This example is important, as it highlights that achieving portfolio diversification can be challenging with an unlisted-only approach.
Volatility
Another key driver is volatility. The lower measured volatility of unlisted investments is a key factor in making private asset ownership attractive to investors. For proponents of unlisted infrastructure investment, lower volatility, along with lower correlations to general market movements, is also expected to support a better risk/return profile. However, in emphasising the lower volatility of unlisted assets, it is important to remember that this characteristic comes with a trade-off: illiquidity and cost.
Diversification case study: US utilities
US electricity utilities offer a case study in the diversification benefits of listed infrastructure. Most US electricity utilities, such as Xcel (US) and Alliant (US), are held in listed vehicles5, as noted in the section above. As a result, access to these assets is predominantly through listed companies.
These listed utilities are high-quality businesses that provide robust regulated rates of return (often in the range of 9-11%) and consistent EPS growth. These companies also offer exposure to key secular trends, including increasing electrification, rising demand for power from data centres and Artificial Intelligence, and US re-industrialisation and manufacturing growth. They operate in constructive, state-level regulatory environments.
Unlisted and private equity funds have historically been able to access US regulated utilities only via minority equity stakes or non-controlling stakes. This reflects a reluctance by regulators to allow majority ownership, with the need for an appropriate operational track record and financial management being critical to owning and operating such complex, essential assets.
Once again, the valuation methodology used is an important difference between listed and unlisted investments. As described in the section above, unlisted infrastructure investments typically apply an appraisal-based valuation methodology that is infrequent. This approach gives valuers the ability to look through ‘transitory’ moves in interest rates and business performance, which could mean that, in a valuation round, a materially lower interest rate is used than market rates. This has a smoothing effect on volatility and therefore returns appear less volatile than listed investments, which use high-frequency, market-observable data for their own calculations. We note that listed infrastructure companies could be expected to exhibit similarly low volatility if the same ‘look through’ rates were applied.
These observations have several investment implications. First, for investors looking to lower volatility in their portfolio, infrastructure as an asset class – regardless of whether it is listed or unlisted – exhibits lower volatility than the equity market. This is shown in Figure 5 below. This makes sense, as the underlying assets for listed and unlisted vehicles are inherently similar and provide stable returns. The steady demand and predictable earnings underpinning these businesses support stable intrinsic valuations over time. Our observation is that the difference in the standard deviation for listed/unlisted infrastructure is a function of the valuation approach used in private markets, rather than an underlying differential in performance.
Figure 5 Infrastructure – listed and unlisted – is a less volatile asset class than equities

Source: Bloomberg, GLIO, Magellan. Analysis of trailing one-year returns for monthly index data 2015-2025. MFG Core Infrastructure data is net of fees and hedged in AUD. Global equities refers to the MSCI World TR index, net of fees and hedged in AUD. Private markets infrastructure refers to the midpoint series aggregate per GLIO.
Second, real-time pricing for listed infrastructure can present an opportunity for investors. Market pricing means investors can take advantage of market mispricing where a company is intrinsically undervalued and shift their portfolio positioning accordingly. This is a distinctly different approach to private infrastructure, where an investor can buy only what is on the market at the time. For example, consider 2022, when the market reacted to steep interest rate hikes. In the period January 2022 to the end of September 2022, the S&P Global Infrastructure Index was down -12.6%, with average monthly returns of -1.3%. Listed infrastructure stocks also slumped in response to the sharp uptick in rates. With many stocks in the listed infrastructure universe trading below their intrinsic valuations, this was a buying opportunity for investors, with listed infrastructure subsequently recovering. By contrast, private markets infrastructure showed still-solid deal activity from Q4 2021 to Q4 2022 (at an average of 676 deals per quarter, and a US$112 billion average aggregate deal value6). However, there was then a noticeable, lagged decline in activity in 2023 (average of 550 deals per quarter, and US$83 billion average aggregate deal value6), with deal activity remaining at these levels in 2024. We note that this decline in deal flow could reflect in part the desire of unlisted funds to avoid realising a price less than what they valued the asset at. This activity is in contrast to listed infrastructure, where investors receive, rather than determine, the market price and therefore can take advantage of market dislocations.
Perceived diversification and volatility benefits affect valuations
The diversification and volatility benefits assigned to private markets infrastructure drive some potentially significant impacts on valuation. That is, investors can pay an observable premium for unlisted infrastructure assets that can ultimately weigh on achieved returns. For investors looking at both listed and unlisted approaches, this is also important to be aware of.
The data suggest investors have historically valued private infrastructure at higher multiples than listed infrastructure. For example, if we look at European airports (Figure 6 below), we can see that unlisted airports, on an EV/EBITDA basis, have received valuations that have averaged around 20x over the last two decades. This compares to around 10x for listed airports. The size of the premium likely reflects the perceived benefits of lower correlations and lower volatility afforded by private market investment options. However, as we have discussed, these benefits are a function of the valuation methodology used, which smooths results for unlisted assets. At the same time, investors have historically been willing to pay a control premium for private infrastructure assets, which reinforces this premium. The rationale is that, out of the public gaze and as a major shareholder, an investor can influence the management of the asset and its performance. However, there is no evidence that unlisted assets have stronger operational performance than listed assets, and gearing has been a notable factor in short-term performance for some unlisted assets (for example, the UK water sector).
Figure 6: Public markets can provide access to comparably high-quality assets at a discount to private markets, as this European airports case study suggests

Source: Company accounts, Magellan analysis
Liquidity
Finally, the one inherent difference between a private infrastructure asset and a listed asset is liquidity. By their very nature, unlisted vehicles are less liquid than those on public markets. Raising capital is not a quick process, and once money is in an unlisted fund, it can take time to extract it. Equally, it takes time to invest capital in unlisted infrastructure assets. The level of dry powder, or undeployed capital, held in private infrastructure funds, currently at $335 billion7 is an important data point, suggesting that deploying capital can also be a lengthy process. This is not necessarily an issue for investors with a long investment time horizon. However, this time lag does weigh on the investor’s realised return if they cannot identify investments with consistently higher returns than those available in listed markets. Furthermore, the volume of uninvested funds and the need to deploy capital present the risks of overpaying for assets, given heightened competition or purchasing lower-quality assets. The closed-end nature of private infrastructure funds can also mean redeeming assets when market conditions are sub-optimal. The valuation on exit is the ultimate proof of performance, as noted, and this can be hard to optimise for an unlisted asset.
Listed infrastructure, on the other hand, is liquid. It is easy to deploy capital into liquid vehicles quickly, and investments are open-ended. Having sufficient liquidity is not only important in times of market stress, but also for regular portfolio management purposes, including rebalancing. Owning a liquid form of the asset class allows the investor to trim or change positions, reflecting changing valuation multiples or outlook on sub-sector or market exposures. We have noted that listed infrastructure also serves as a liquid completion sleeve for less-liquid allocations.
Performance figures suggest comparable outcomes for listed and unlisted approaches
The proof of the benefits of investment in listed or unlisted infrastructure is in performance. While there are some near-term differences, reflecting the valuation and construction issues discussed above, over an investment cycle listed and unlisted infrastructure show solid real returns. This is illustrated in Figure 7 below, looking at total returns for listed and unlisted infrastructure, and also equities. For the period December 2009 to June 20258, the MFG Core Infrastructure returned 10.7% per annum9, while private markets infrastructure returned 9.2%. The data show that listed infrastructure achieved a return premium to unlisted infrastructure over this period. We note that this has been a strong period for infrastructure investments, and in the future investors could expect a more moderate rate of return, given the highly defensive nature of this strategy. Returns of CPI plus 5% are considered reasonable for the MFG Core Infrastructure over the investment cycle.
Figure 7: Listed and unlisted infrastructure have recorded comparable returns over time
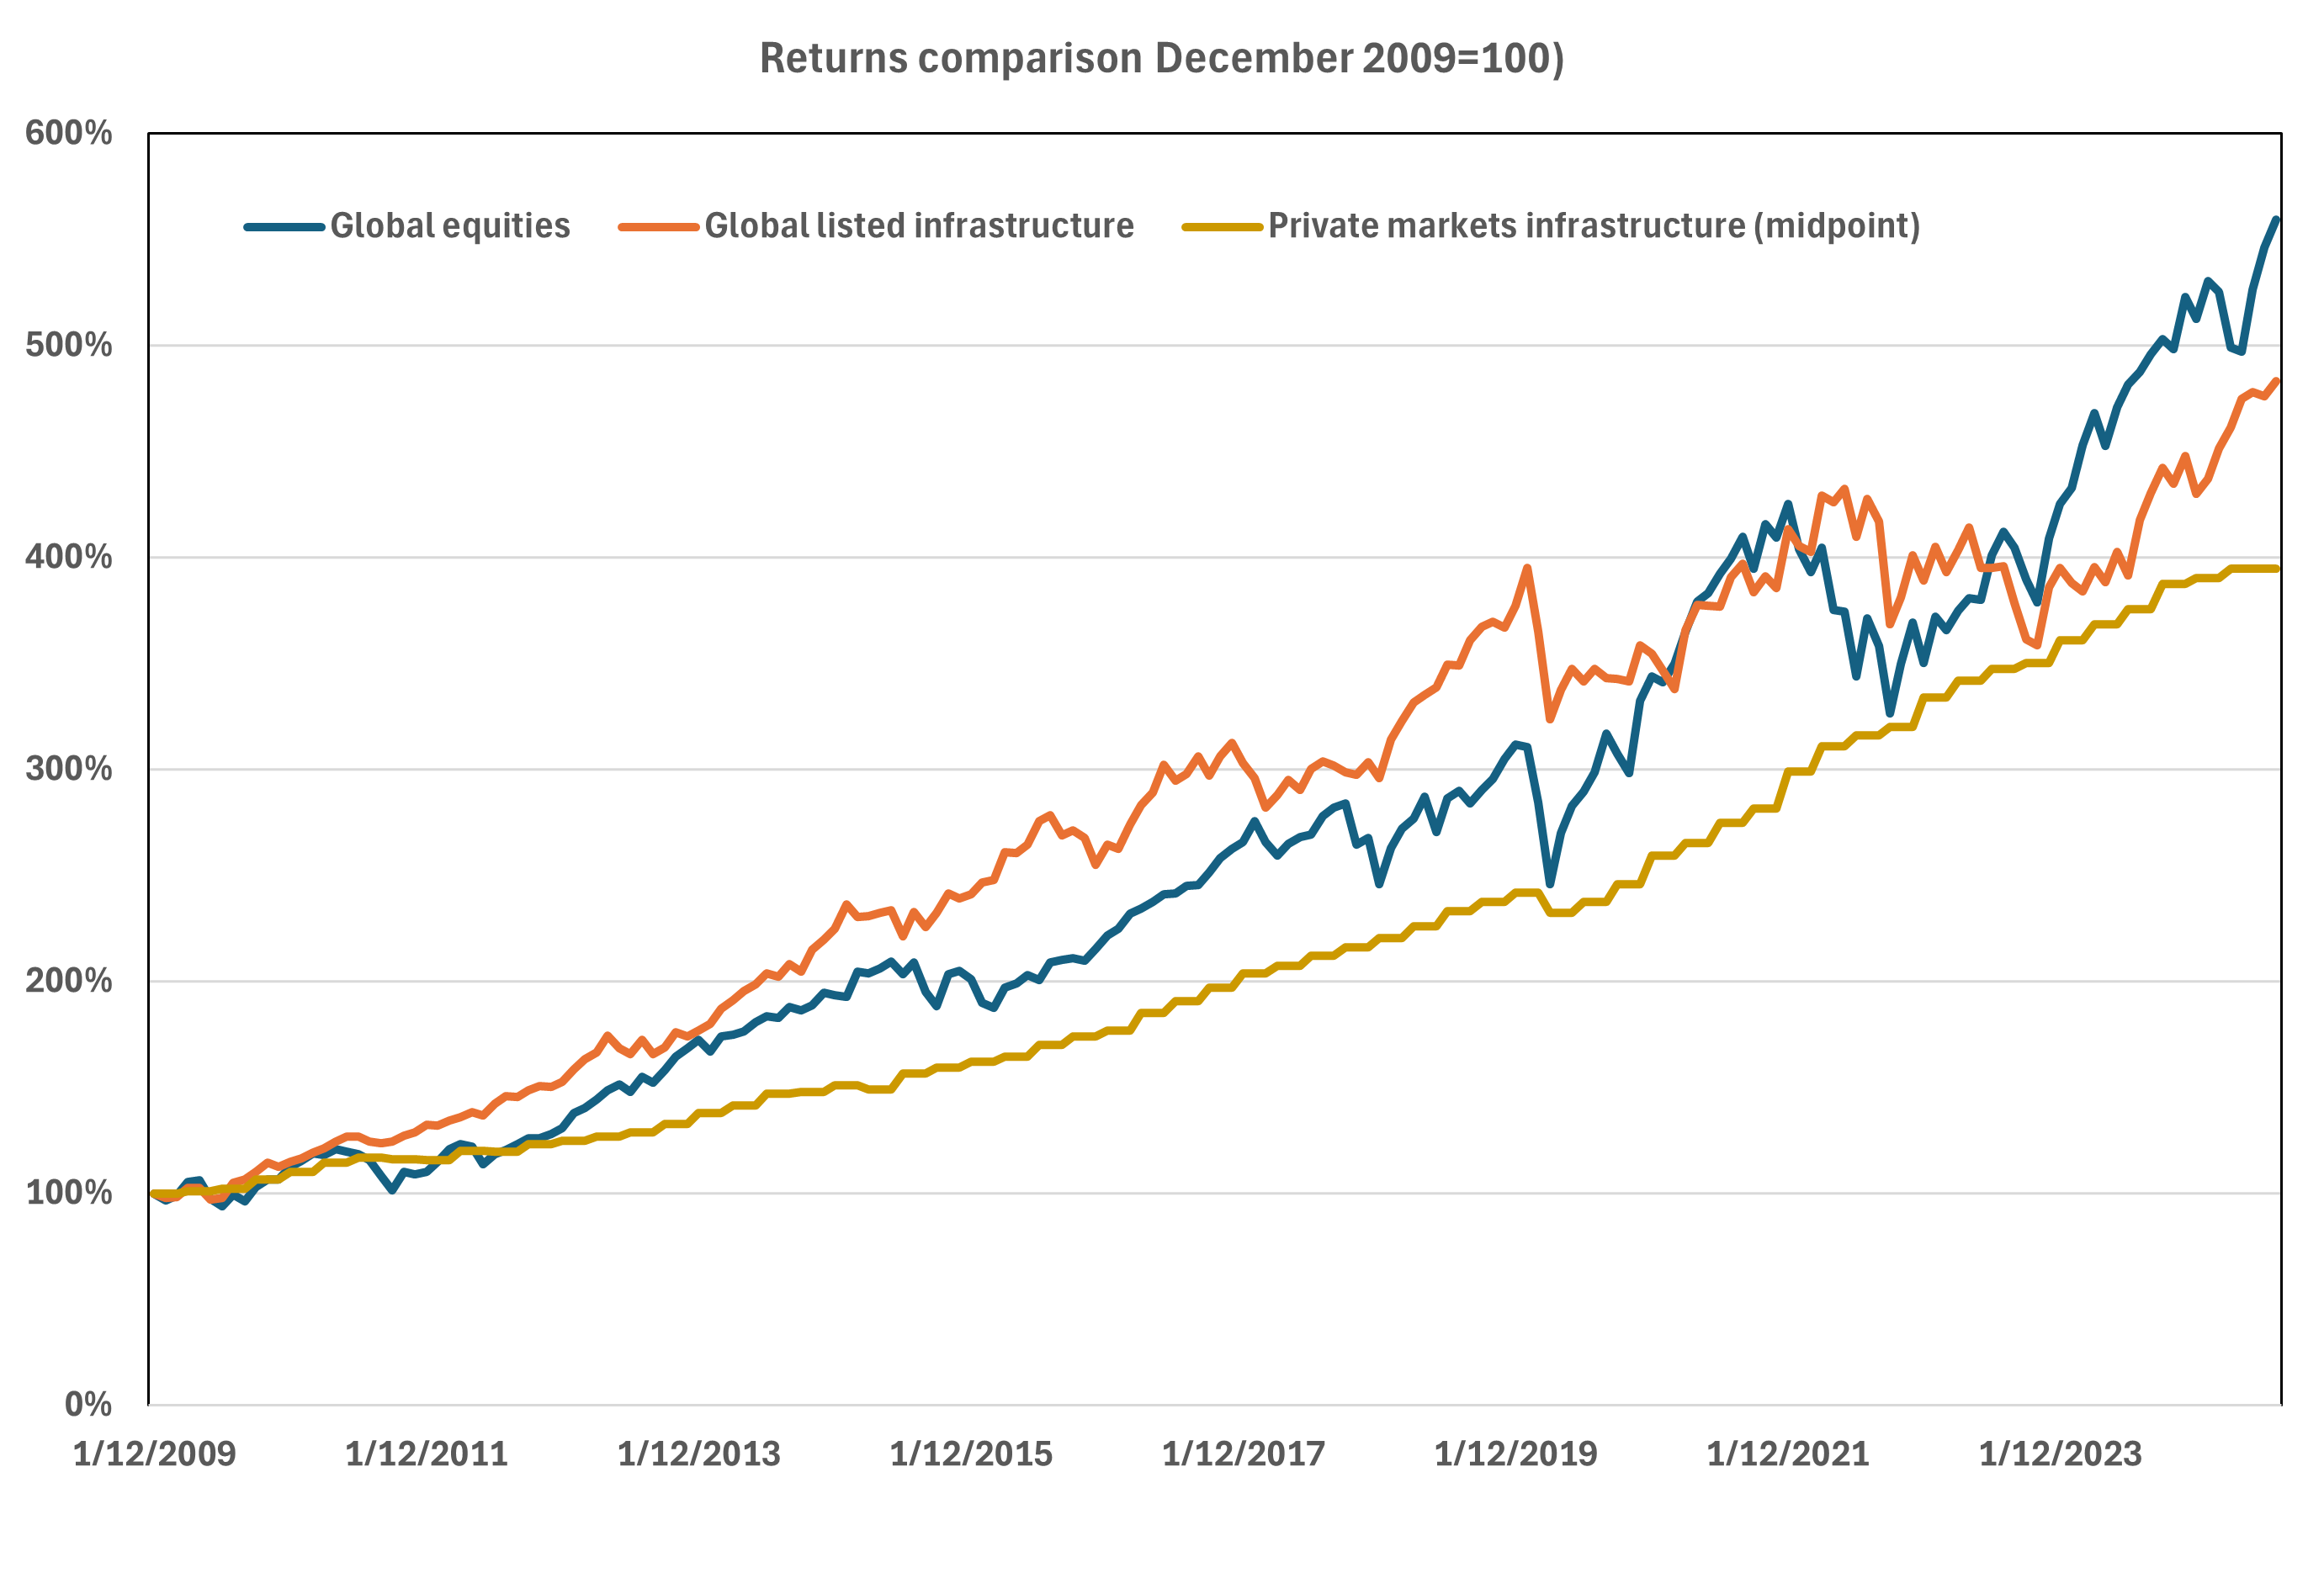
Source: GLIO, Bloomberg, Magellan analysis. Global equities refers to the MSCI World, TR index, hedged in AUD. Listed infrastructure refers to the MFG Core Infrastructure Strategy, net of fees and hedged in AUD. Private markets infrastructure refers to the midpoint series aggregate per GLIO, which is net of fees.
Listed and unlisted infrastructure exposures are complementary
Reflecting the differing characteristics across diversification, volatility and liquidity for listed and unlisted infrastructure investments, along with comparable returns over time, investors could likely benefit from a combination of listed and listed infrastructure in their portfolio. Investors can strategically combine listed and unlisted assets in a way that best works with their risk/return profile. For example, if an existing portfolio contains only private infrastructure, the addition of listed infrastructure could support performance through greater diversification and liquidity to better take advantage of market dislocations.
Ultimately, we see that adding or increasing the exposure of a multi-asset portfolio to infrastructure can support returns while enhancing its risk/return profile.
Magellan Infrastructure Team
1 Preqin, July 2025. Data for the decade 2013-2023
2 Refer to the Magellan report, Powering through uncertainty, June 2025. Our analysis shows ROE for these high-quality listed regulated utilities at 10-12% over time (2005-2025).
3 Looking at rolling, annual returns over a ten-year window from 2015 to 2024, our analysis suggests a consistent, positive correlation of around 0.35-0.55 between listed and unlisted infrastructure returns. This holds except for the three years from 2022 to 2025, where interest rate increases drove several consecutive months of negative performance for listed infrastructure.
4 GLIO, Infralogic
5 Refer to the Edison Electric Institute
6 Preqin
7 Preqin, as at end of the March quarter 2025
8 Period selected to cover performance since the inception of the MFG Core Infrastructure
9 Net return, hedged and in AUD
Important Information: This material is not intended to constitute advertising or advice of any kind and you should not construe the contents of this material as legal, tax, investment or other advice. In making an investment decision, you should read and consider any relevant offer documentation applicable to any investment product or service and must rely on your own examination of the same and consider obtaining professional investment advice tailored to your specific circumstances before making any investment decision.
The investment program of the strategy or strategies presented herein (‘Strategy’) is speculative and may involve a high degree of risk. The Strategy is not intended as a complete investment program and is suitable only for sophisticated investors who can bear the risk of loss. The Strategy may lack diversification, which can increase the risk of loss to investors. The Strategy’s performance may be volatile. Past performance is not necessarily indicative of future results and no person guarantees the future performance of the Strategy, the amount or timing of any return from it, that asset allocations will be met, that it will be able to implement its investment strategy or that its investment objectives will be achieved. Statements contained in this material that are not historical facts are based on current expectations, estimates, projections, opinions and beliefs and such statements involve known and unknown risks, uncertainties and other factors, and undue reliance should not be placed thereon. This material may contain ‘forward-looking statements’. Actual events or results or the actual performance of the Strategy or any financial product or service may differ materially from those reflected or contemplated in such forward-looking statements. The Strategy will have limited liquidity, no secondary market for interests in the Strategy is expected to develop and there are restrictions on an investor’s ability to withdraw and transfer interests in the Strategy. The management fees, incentive fees and allocation and other expenses of the Strategy will reduce trading profits, if any, or increase losses.
No representation or warranty is made with respect to the correctness, accuracy, reasonableness or completeness of any of the information contained in this material. This information is subject to change at any time and no person has any responsibility to update any of the information provided in this material. This material may include data, research and other information from third party sources. No guarantee is made that such information is accurate, complete or timely and no warranty is given regarding results obtained from its use. The issuer of this material and its related entities and affiliates will not be responsible or liable for any losses, whether direct, indirect or consequential, including loss of profits, damages, costs, claims or expenses, relating to or arising from your use or reliance upon any part of the information contained in this material including trading losses, loss of opportunity or incidental or punitive damages.
This material and the information contained within it may not be reproduced, or disclosed, in whole or in part in any circumstances. , Further information regarding any benchmark referred to herein can be found at www.magellaninvestmentpartners.com/funds/benchmark-information/. Any third-party trademarks contained herein are the property of their respective owners and are used for information purposes and only to identify the company names or brands of their respective owners. (080825-#i1)
United Kingdom: This material has been prepared by Magellan Asset Management Limited (ABN 31 120 593 946 AFSL 304 301) doing business as Magellan Investment Partners and is distributed in the United Kingdom by Magellan Investment Partners (UK) Limited (FRN: 1037936), an appointed representative of Sentinel Regulatory Services Ltd (FRN: 1007093) which is authorised and regulated by the Financial Conduct Authority. This material does not constitute an offer or inducement to engage in an investment activity under the provisions of the Financial Services and Markets Act 2000 (FSMA). This material does not form part of any offer or invitation to purchase, sell or subscribe for, or any solicitation of any such offer to purchase, sell or subscribe for, any shares, units or other type of investment product or service. This material or any part of it, or the fact of its distribution, is for background purposes only. This material has not been approved by a person authorised under the FSMA and its distribution in the United Kingdom and is only being made to persons in circumstances that will not constitute a financial promotion for the purposes of section 21 of the FSMA as a result of an exemption contained in the Financial Services and Markets Act 2000 (Financial Promotion) Order 2005 (FPO) as set out below. This material is exempt from the restrictions in the FSMA as it is to be strictly communicated only to ‘investment professionals’ as defined in Article 19(5) of the FPO.
United States: This material has been prepared by Magellan Asset Management Limited (ABN 31 120 593 946 AFSL 304 301) doing business as Magellan Investment Partners (‘Magellan’) which is a registered investment adviser. The investment strategies described herein are distributed in the United States by Frontier Partners, Inc. (‘Frontier’), a U.S.-registered investment adviser. For the purposes of the US Securities Act 1933, Magellan and Frontier are affiliated entities. Registration as an investment adviser does not imply any level of skill or training. This material is not intended as an offer or solicitation for the purchase or sale of any securities, financial instrument or product or to provide financial services. It is not the intention of Magellan to create legal relations on the basis of information provided herein. Past performance does not guarantee future results. Where performance figures are shown net of fees charged to clients, the performance has been reduced by the amount of the highest fee charged to any client employing that particular strategy during the period under consideration. Actual fees may vary depending on, among other things, the applicable fee schedule and portfolio size. Fees are available upon request and also may be found in Part II of Magellan’s Form ADV.
Canada: This material is provided to you by Magellan Asset Management Limited (ABN 31 120 593 946 AFSL 304 301) doing business as Magellan Investment Partners (‘Magellan’). Magellan is not registered in any province in Canada. The head office of Magellan is in Sydney, Australia and all or substantially all of its assets are situated outside of Canada. Due to the foregoing, there may be difficulty enforcing legal rights against Magellan.
South Africa: This material is provided to you by Magellan Asset Management Limited (ABN 31 120 593 946 AFSL 304 301) doing business as Magellan Investment Partners, who in accordance with FAIS Notice 55 of 2023 issued by the Financial Sector Conduct Authority, Magellan Investment Partners is exempted from section 7(1) of the Financial Advisory and Intermediary Services Act, 2002 (Act No. 37 of 2002). This material is not an offer in terms of Chapter 4 of the Companies Act, 2008.
UAE: This material has been produced by Magellan Asset Management Limited (ABN 31 120 593 946 AFSL 304 301) doing business as Magellan Investment Partners. This material is not for distribution to any other person. This material, and the information contained herein, does not constitute, and is not intended to constitute, a public offer of securities in the United Arab Emirates (‘UAE’) and accordingly should not be construed as such. Any offer of securities or financial services is made only to a limited number of exempt Professional Investors in the UAE who fall under one of the following categories: federal or local governments, government institutions and agencies, or companies wholly owned by any of them.
No securities or services have been approved by or licensed or registered with the UAE Central Bank, the Securities and Commodities Authority, the Dubai Financial Services Authority, the Financial Services Regulatory Authority or any other relevant licensing authorities or governmental agencies in the UAE (the ‘Authorities’). The Authorities assume no liability for any investment that the named addressee makes as a Professional Investor. This material is for the use of the named addressee only and should not be given or shown to any other person (other than employees, agents or consultants in connection with the addressee’s consideration thereof).
Other jurisdictions: This material is provided to you by Magellan Asset Management Limited (ABN 31 120 593 946 AFSL 304 301) doing business as Magellan Investment Partners. No distribution of this material will be made in any jurisdiction where such distribution is not authorised or is unlawful. This material does not constitute, and may not be used for the purpose of, an offer or solicitation in any jurisdiction or in any circumstances in which such an offer or solicitation is unlawful or not authorized or in which the person making such offer or solicitation is not qualified to do so. UID168